START HERE
A shared market-structure workflow
Start with the GEX Heatmap to locate the concentration and sign of gamma exposure across nearby expirations. Then select the tool that fits your decision: a session summary, intraday change map, Gamma Map, cross-market comparison, or price chart.
Plus approximately 50 widely followed equity symbols. Coverage continues to expand.
CORE FEATURE
GEX Heatmap
The GEX Heatmap displays positive and negative gamma exposure by strike across the selected symbol's five nearest expiration dates. During trading hours, the map refreshes as the structure changes.
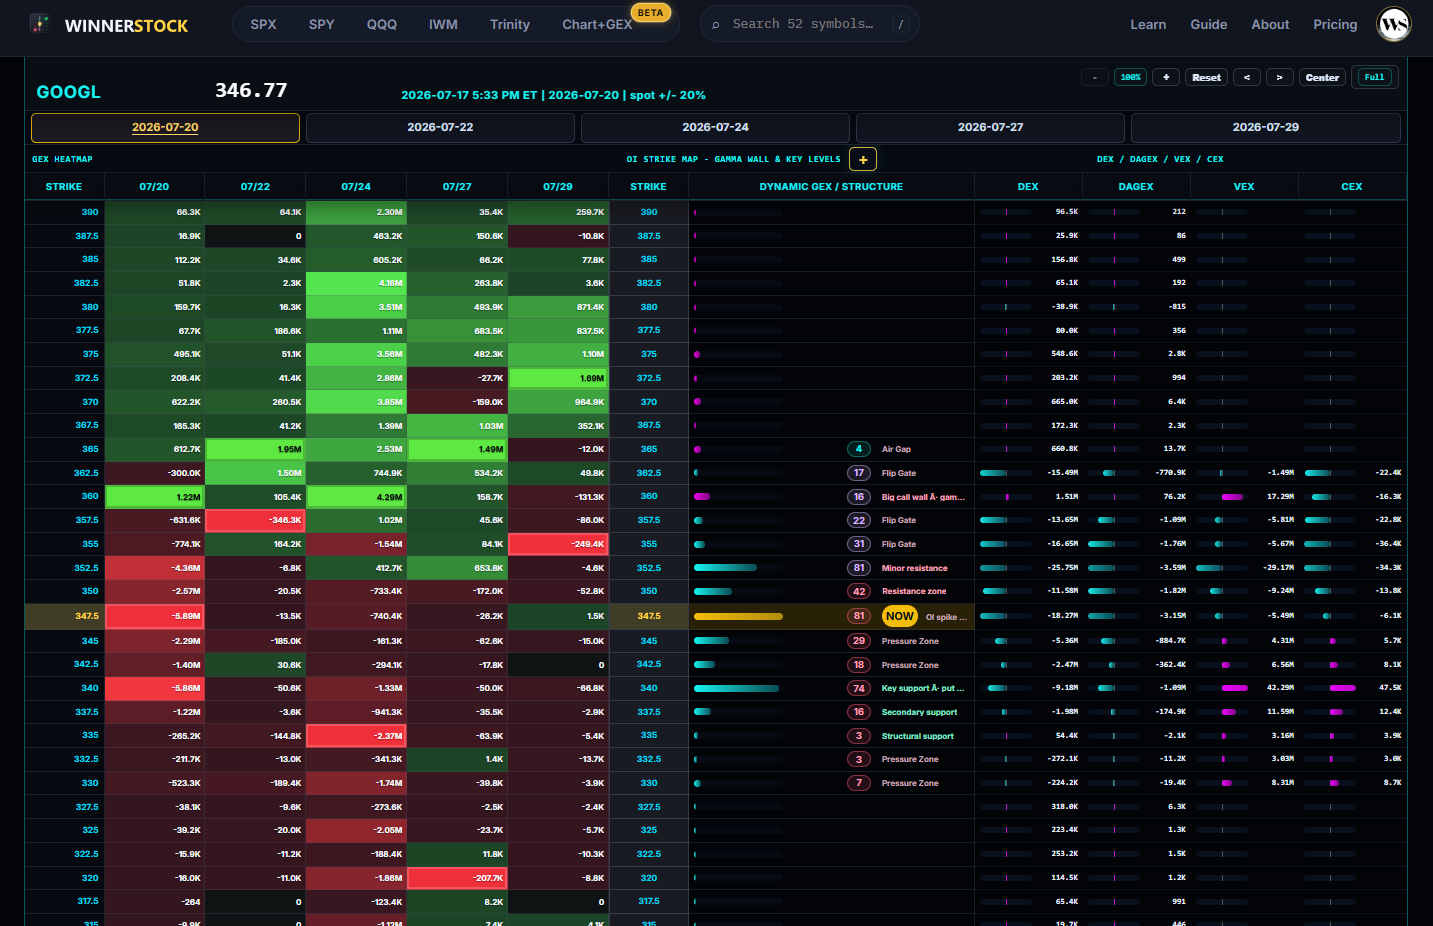
Read the sign - positive and negative GEX show where exposure differs by strike and expiration.
Add context - use DEX, DAGEX, VEX, and CEX as supporting structure references.
Change the lens - select an expiration date to focus the map and related bar data.
SESSION INTELLIGENCE
Daily Review
Daily Review summarizes the selected symbol's key market-structure conditions for the current session. It is built for a fast orientation before you inspect individual charts and levels.
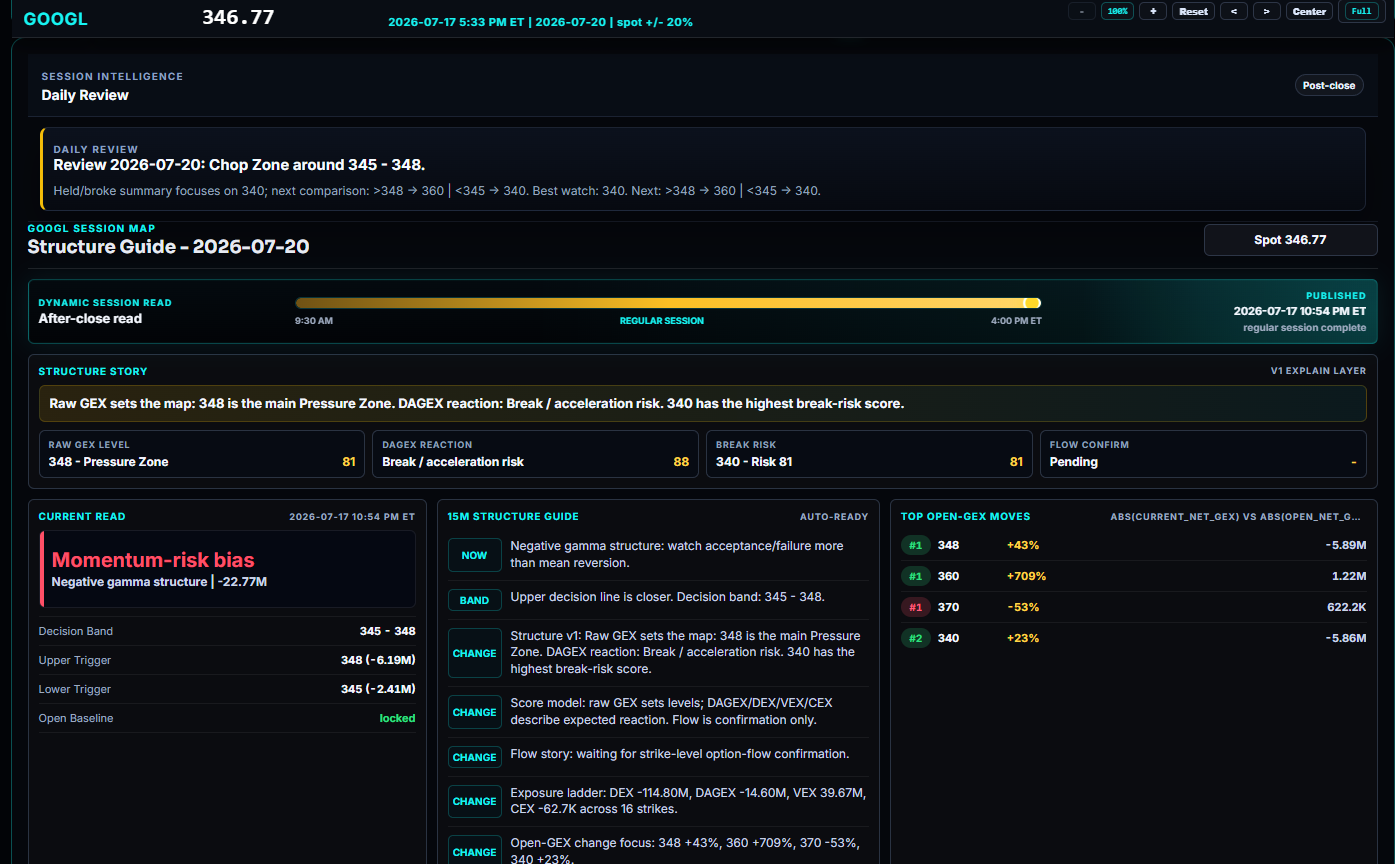
Check the session state and key levels first. Use the summary to decide which detail module deserves your attention next - it is an organized market read, not a trading recommendation.
WORKFLOW TOOL
AI Context Export
AI Context Export turns WINNERSTOCK market-structure data into clean, AI-readable text. Copy the selected symbol and expiration context, then paste it into ChatGPT, Claude, or another compatible assistant for the analysis you choose.
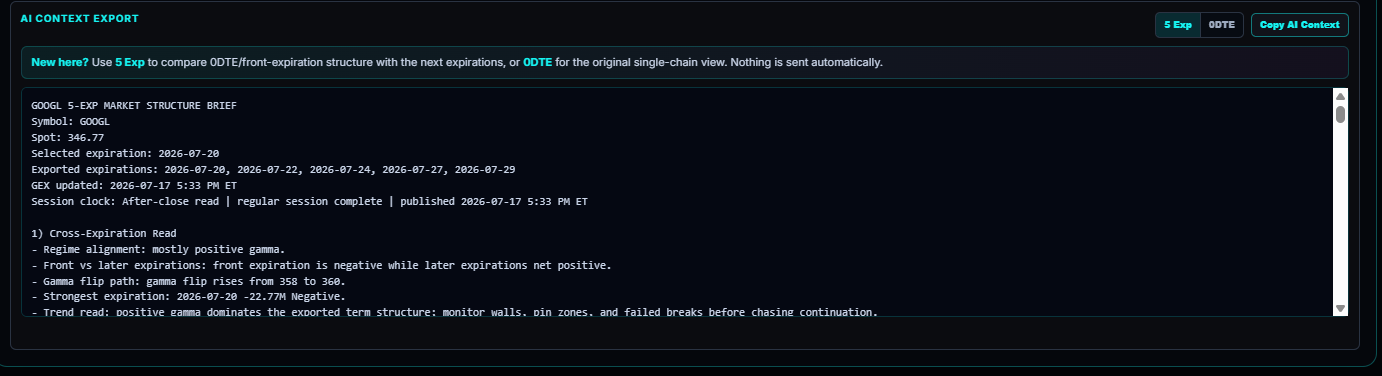
- 1Select a symbol and expiration view.
- 2Choose Copy AI Context.
- 3Paste it into your preferred AI assistant and ask the question you need answered.
INTRADAY GEX MOVERS
Strike Pressure Matrix
The Strike Pressure Matrix tracks how positive and negative 0DTE GEX changes by strike throughout the session, measured against that strike's opening GEX level.
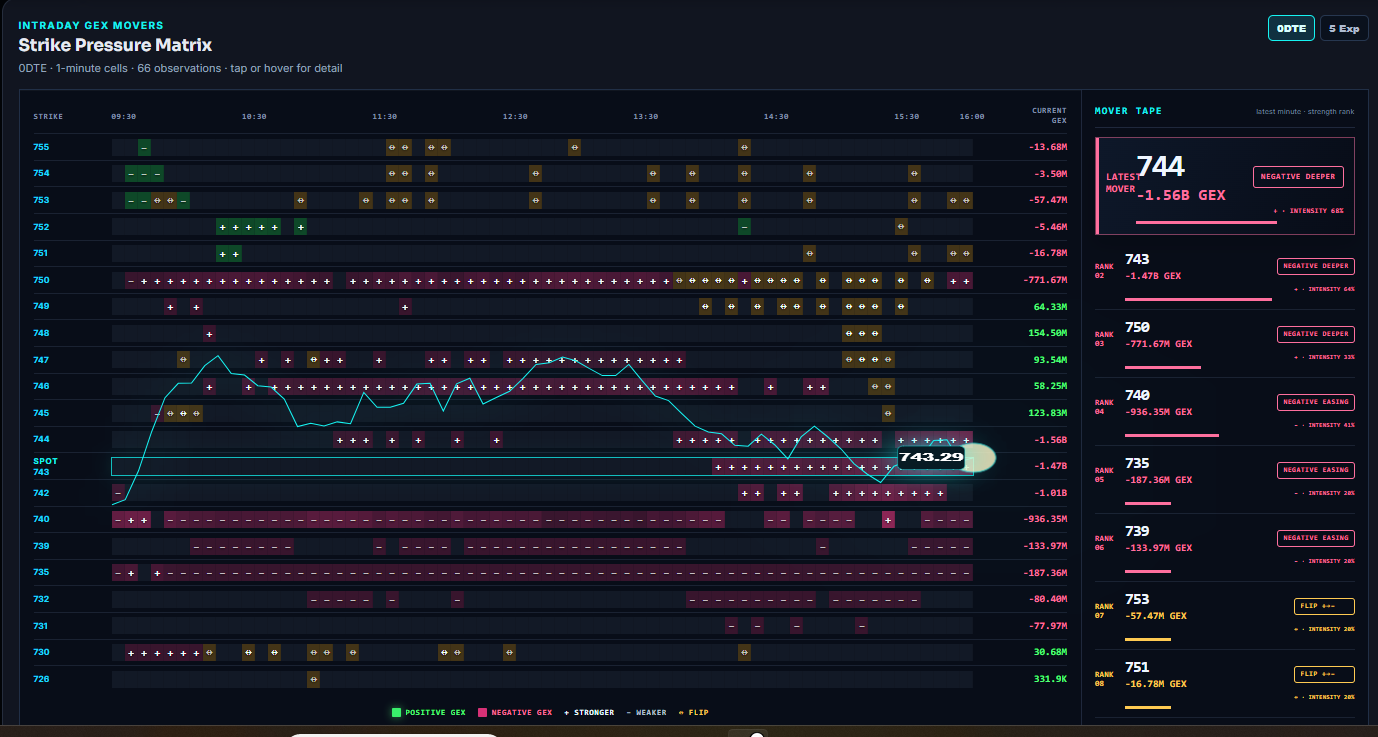
Study change over time. Observe whether exposure is decaying, strengthening, or moving between strikes.
Keep it contextual. A changing exposure profile can alter a strike's importance during the session.
INTRADAY GEX MOVERS
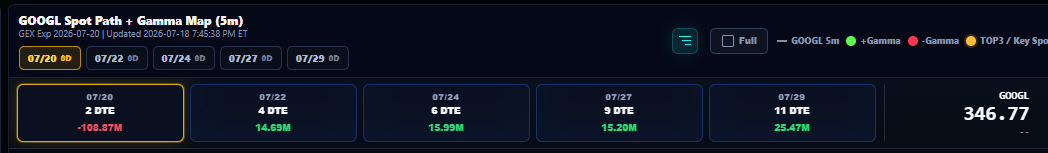
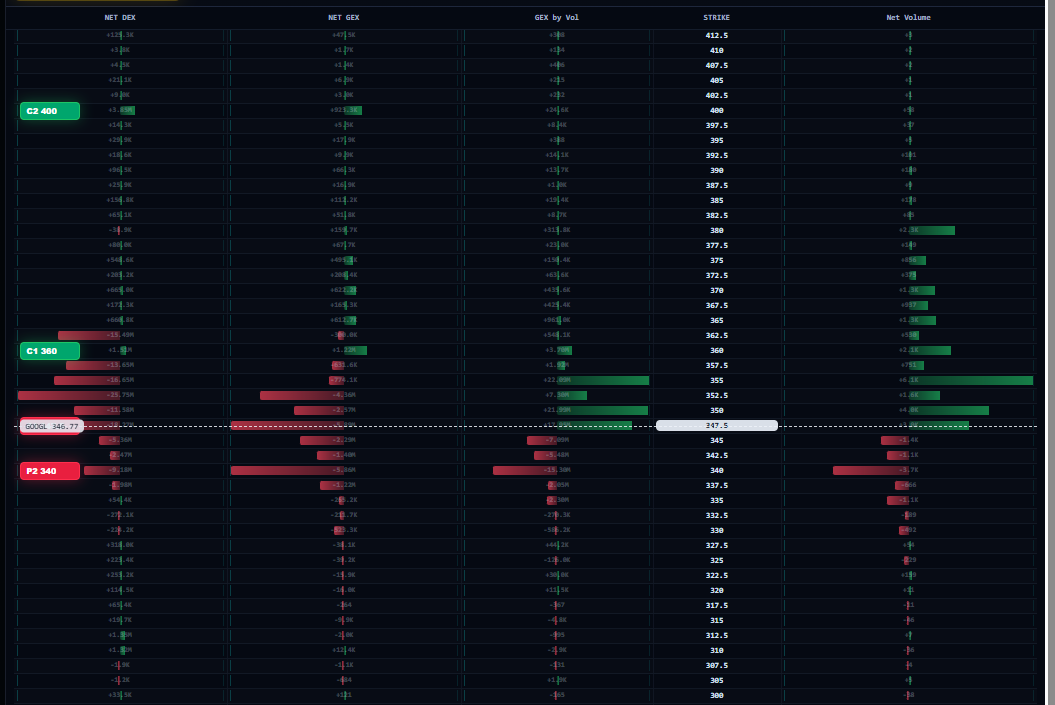
Spot + Gamma
Spot + Gamma opens a table and chart view of the selected symbol's Gamma Map. It brings expiration summaries together with strike-level NET DEX, NET GEX, GEX by Vol, and NET Volume distributions.
CROSS-MARKET VIEW
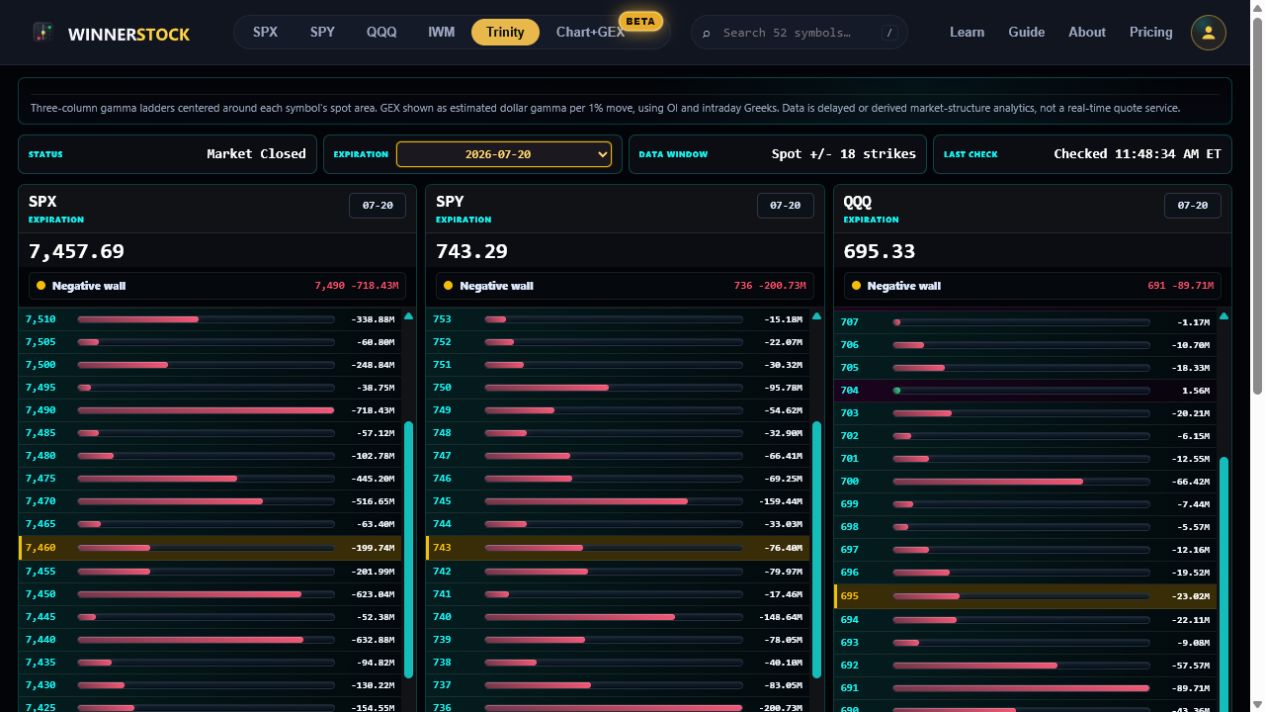
Trinity Chart
Trinity keeps SPX, SPY, and QQQ gamma levels in one coordinated view. Compare the current session or a selected expiration to see whether the three markets confirm or diverge.
PRICE + EXPOSURE
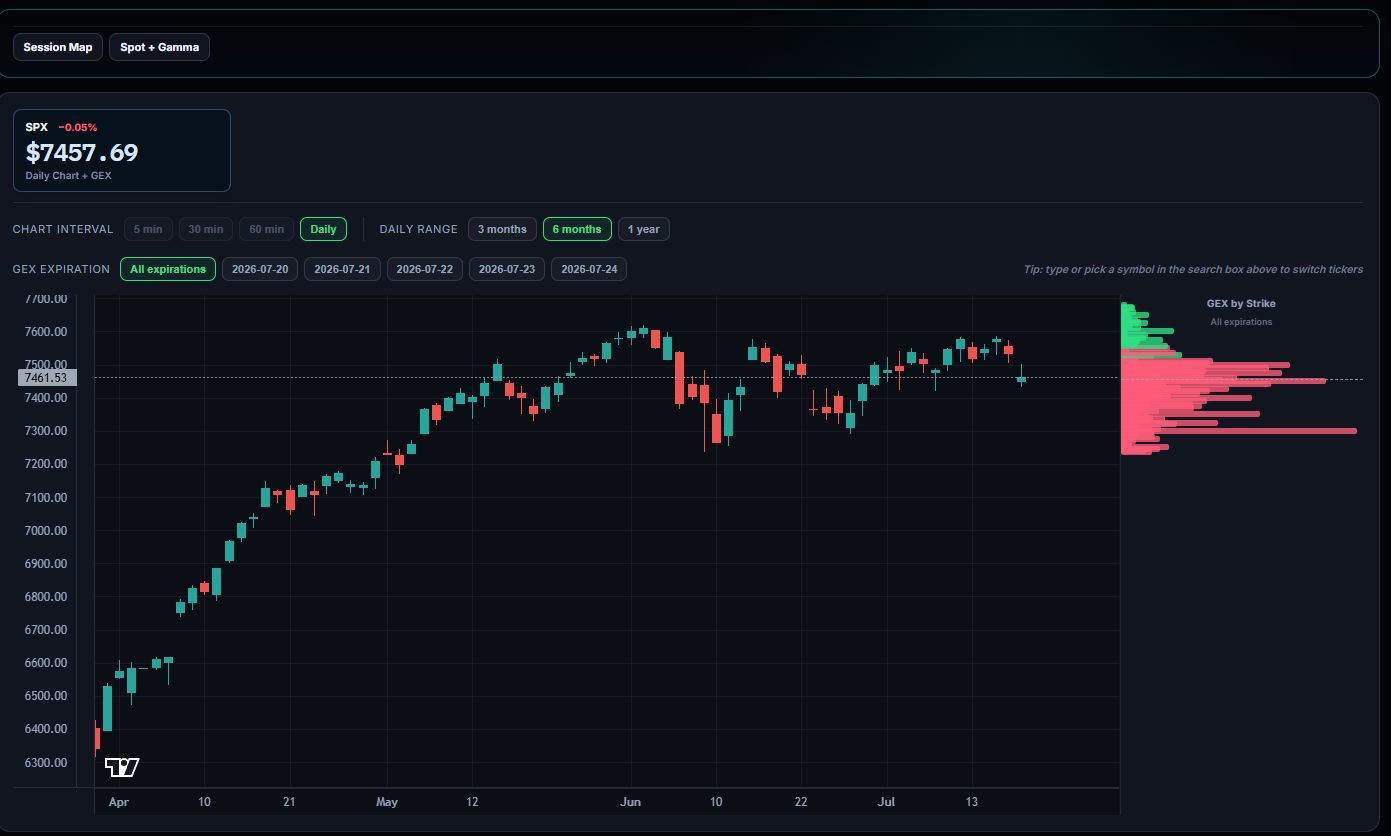
Chart + GEX
Chart + GEX pairs candlestick price action with GEX-by-strike distributions. Choose a 5-minute, 30-minute, 60-minute, or daily interval, then review cumulative GEX across five expirations or isolate a single expiration.
ORDER-FLOW INTELLIGENCE
Premium Flow
Premium Flow is an intraday view designed to show how options premium is moving through the market. It brings directional net flow, call and put net premium, sweep activity, classified prints, and premium-by-strike into one coordinated workspace.
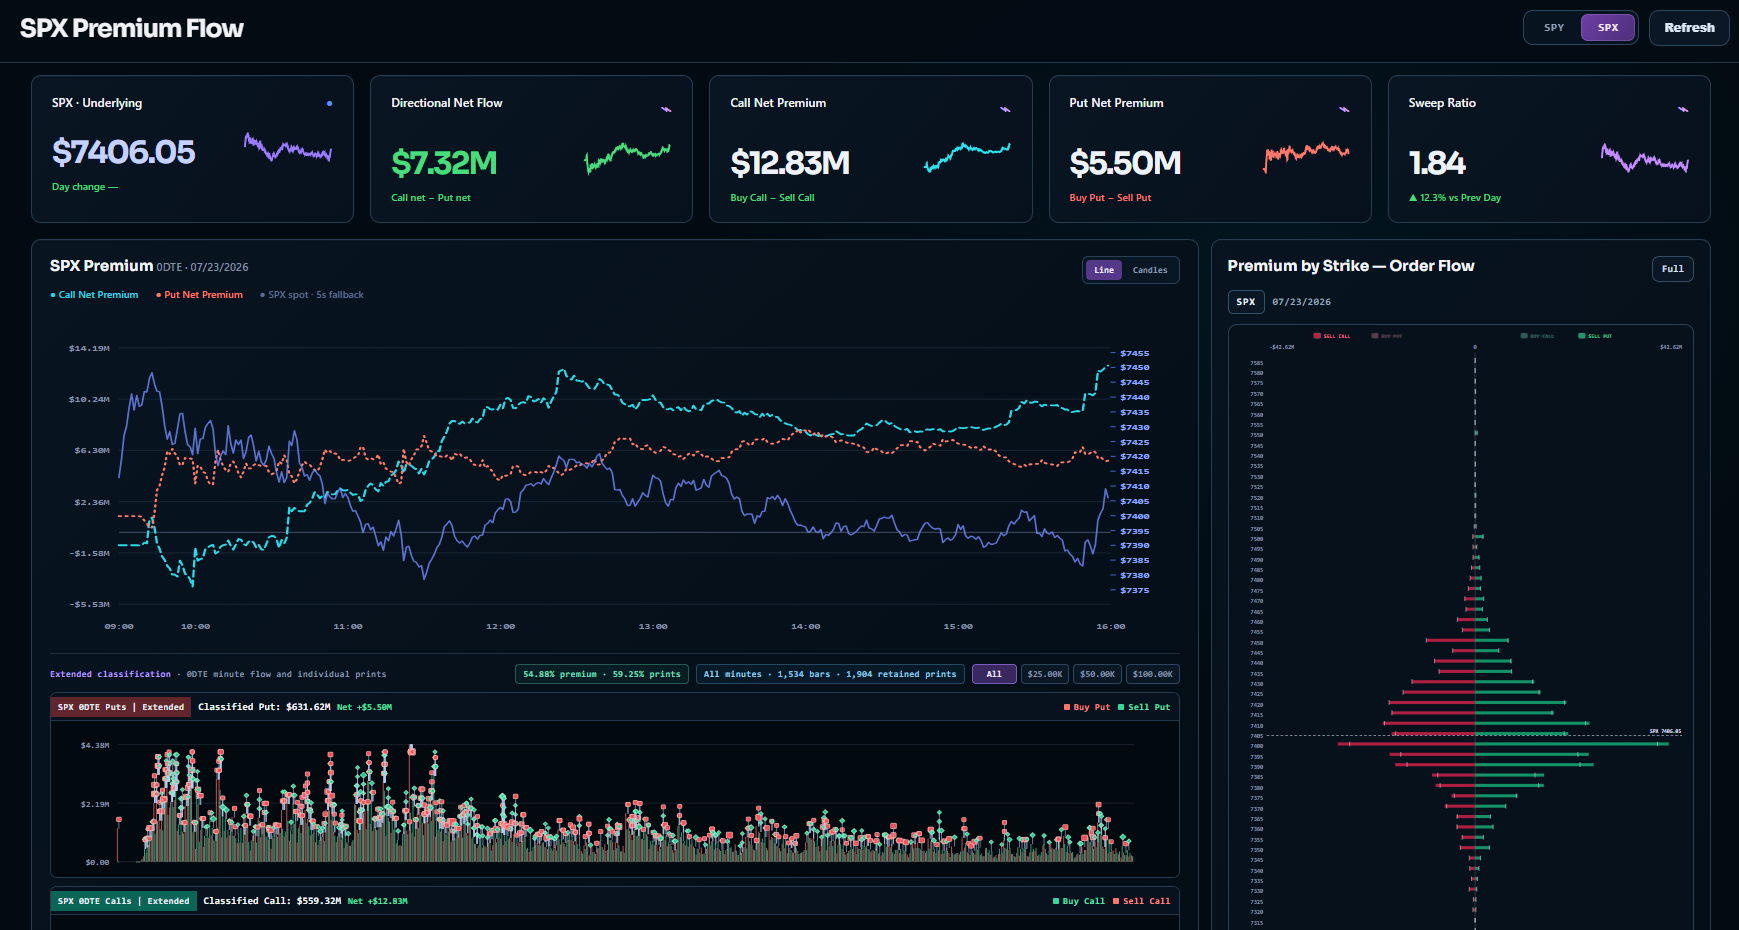
Read direction - compare directional net flow with call and put net premium through the session.
Inspect activity - review sweep ratio and classified call/put prints for additional flow context.
Locate concentration - use premium by strike to see where order-flow activity is clustering.
IMPORTANT
Data, timing, and risk
WINNERSTOCK provides derived market-structure analytics for education and research. It is not a brokerage platform, a raw options feed, financial advice, or a recommendation to trade.
Check freshnessConfirm the visible timestamp and market/session state before relying on any view.
Levels can moveSpot, expiration, volatility, open interest, and market events can change the structure quickly.
Use your own risk rulesCombine these views with independent research, liquidity awareness, and risk management.