SPX market intelligence
Structure, before the next move.
A clear working view of options positioning and live price action for SPX traders.
Intraday GEX Movers
See pressure build across the session.
Track positive and negative GEX as price moves through key strikes, with the mover tape keeping the strongest changes in view.
Continue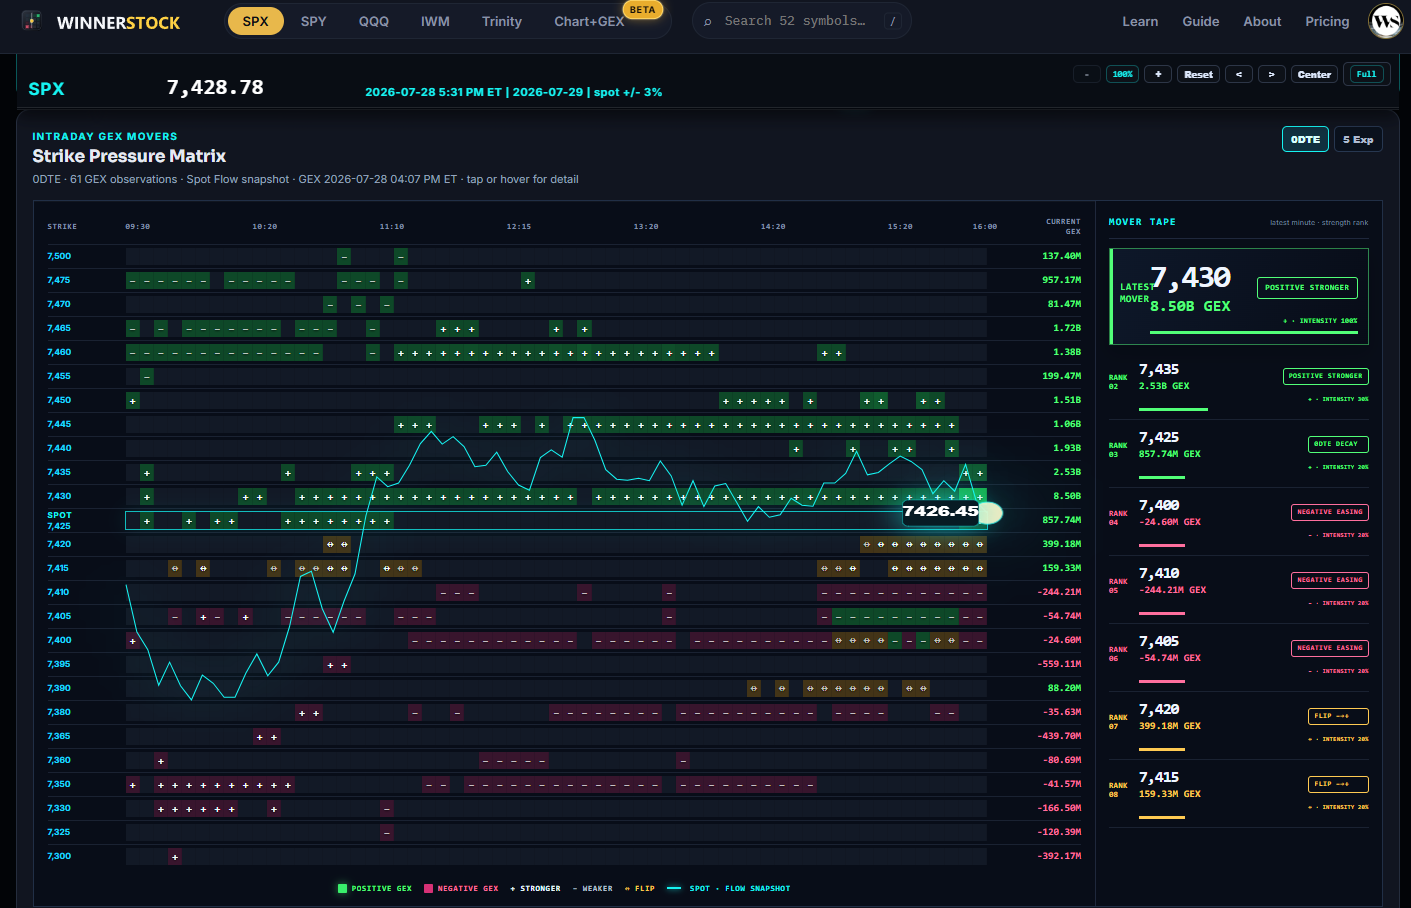
Decision View
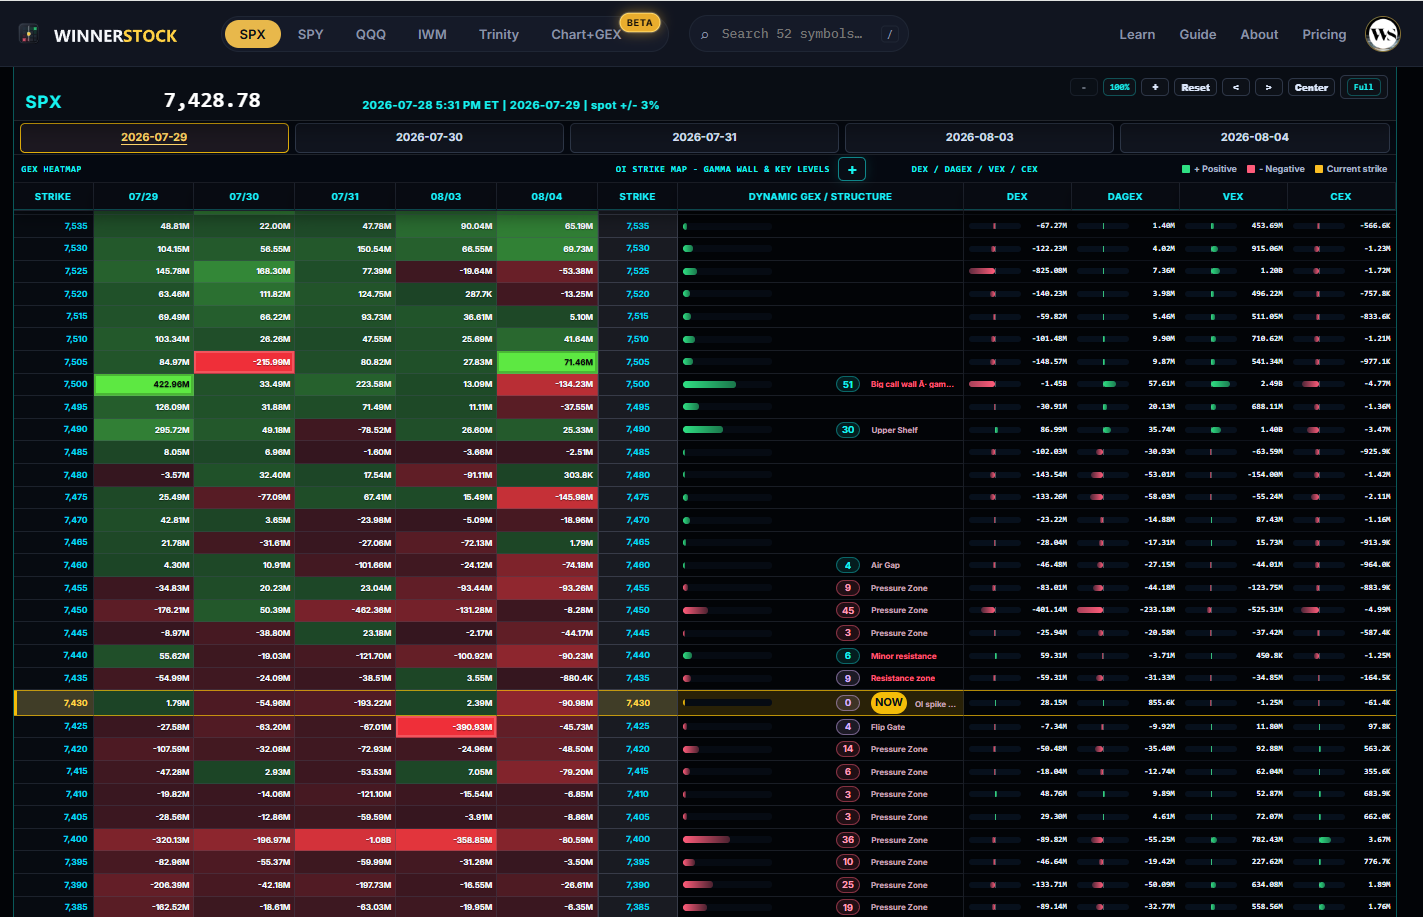
Read the whole gamma ladder at once.
Net DEX, Net GEX, volume, strike, and directional pressure stay aligned around live SPX price.
Continue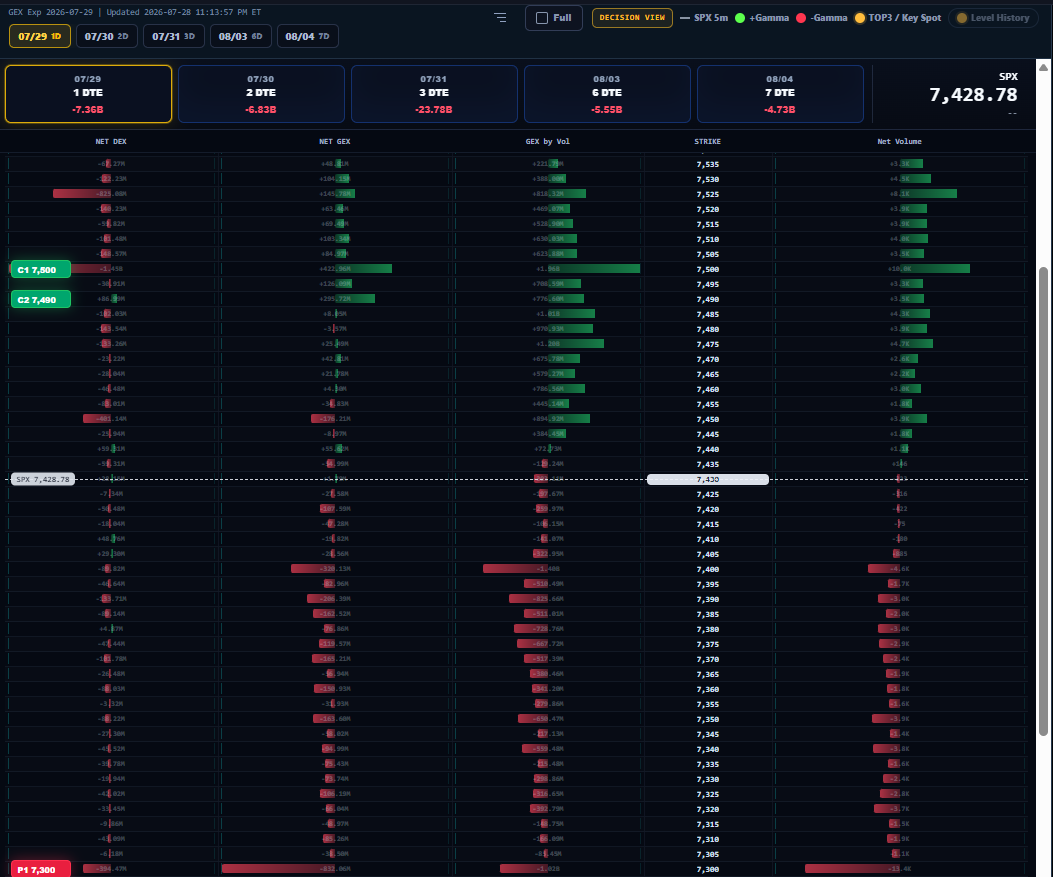
Trinity GEX
Compare SPX, SPY, and QQQ together.
Three index ladders show where positive and negative walls are forming across the broader market.
Continue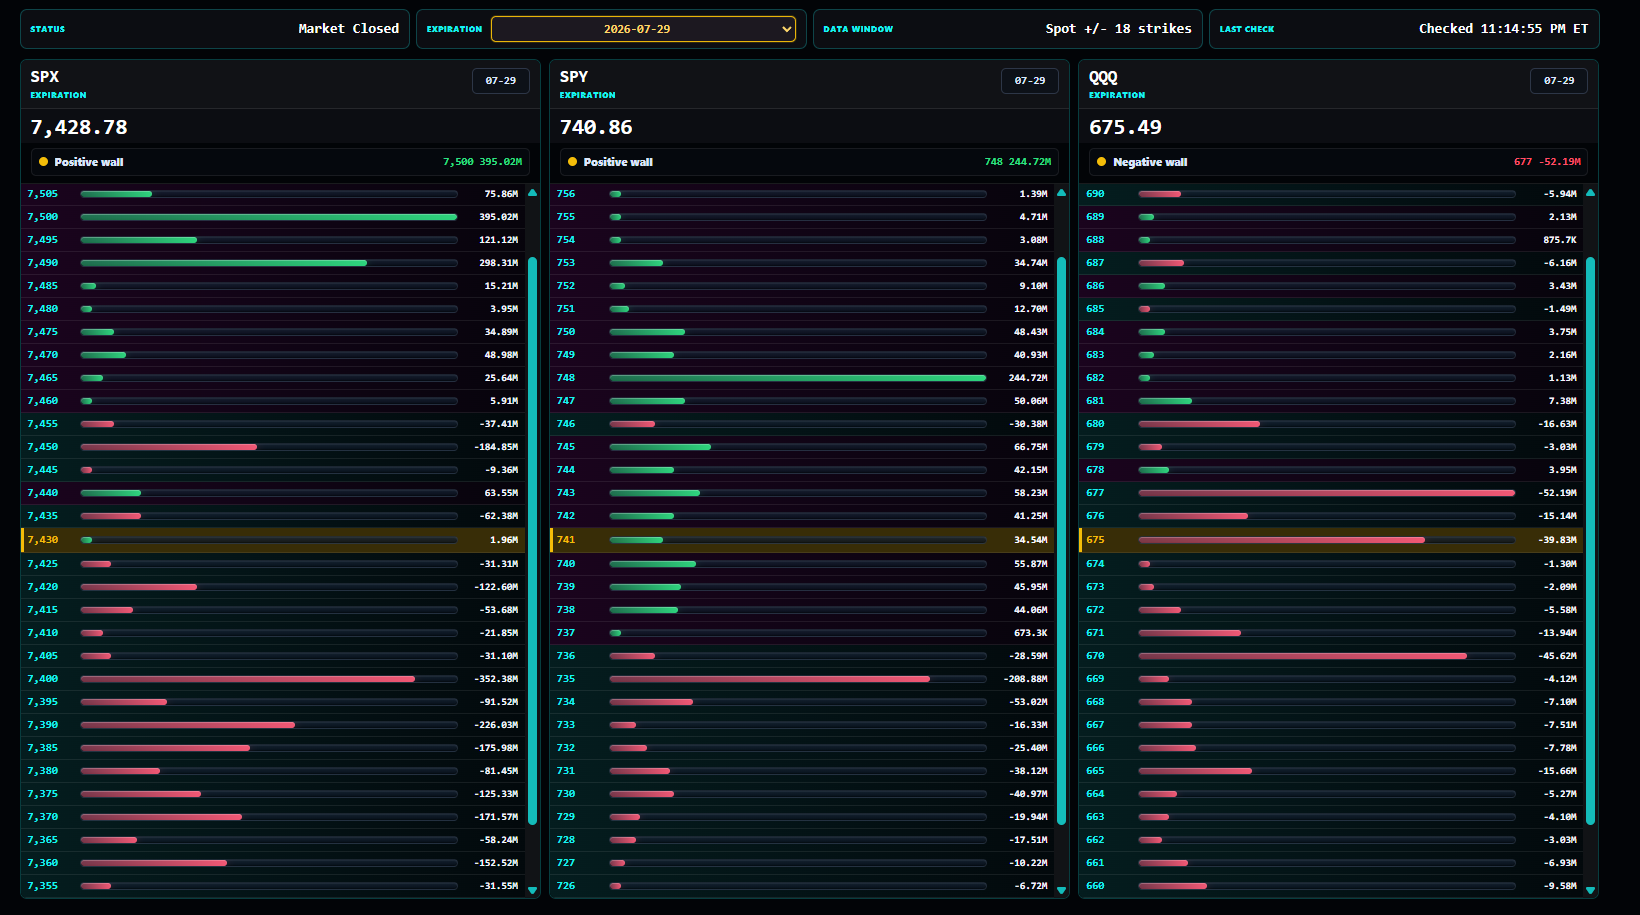
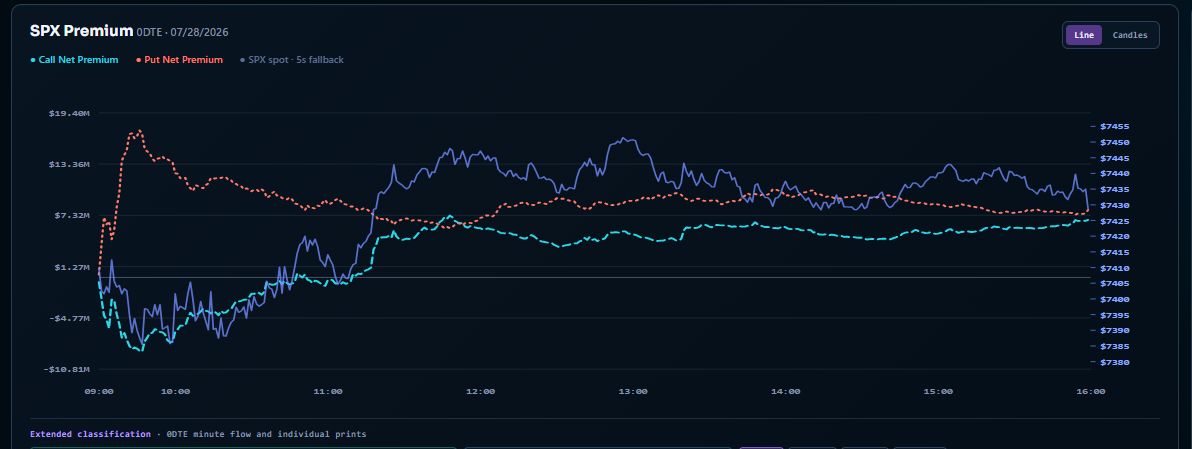
Chart + GEX / Premium Flow
Put price action and premium flow on the same desk.
A long-range market chart and intraday premium flow work side by side for a complete context read.
Continue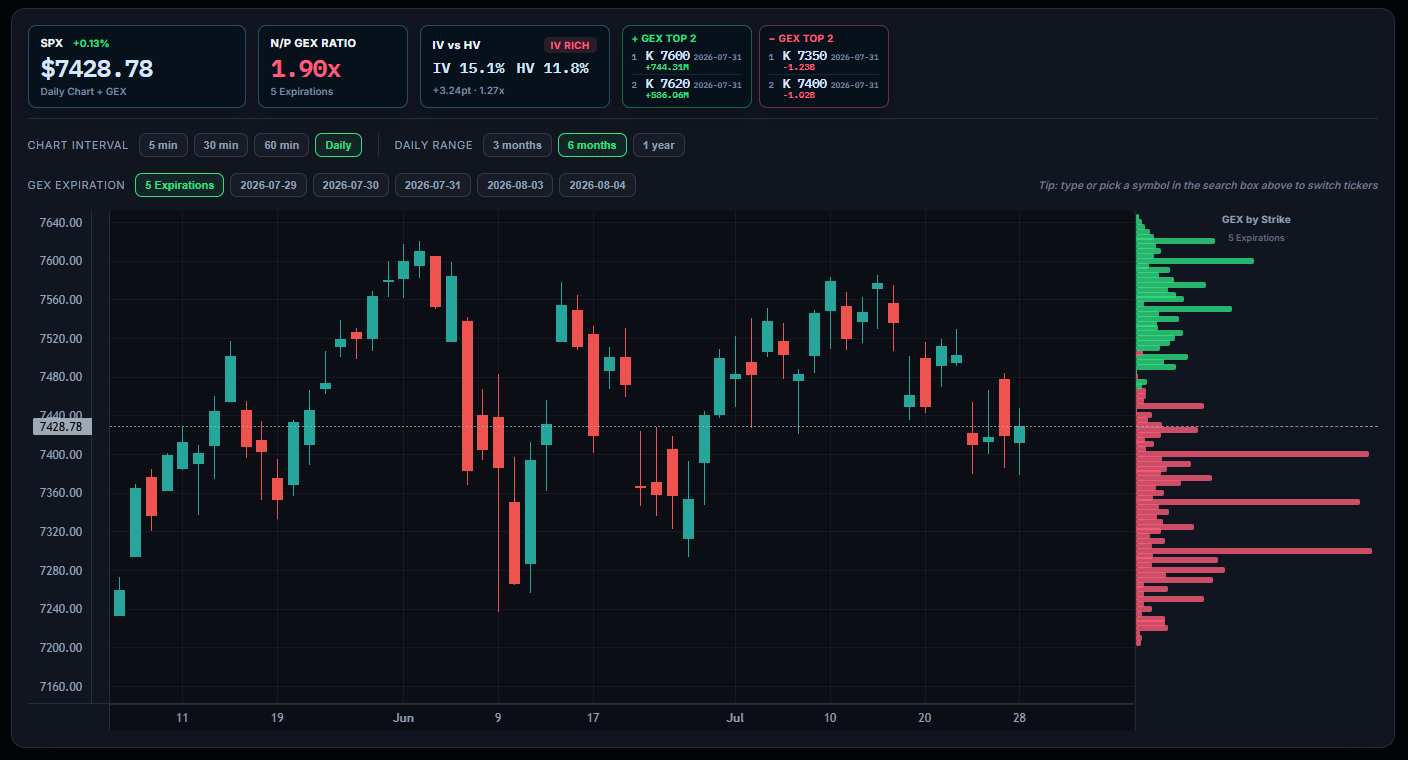
Unusual Options Flow
Find the option prints that deserve attention.
Scan large premium, sweep, block, and multi-leg trades with symbol, expiration, strike, side, spot, size, open interest, volume/OI, price, and premium in one focused tape.
Open Flow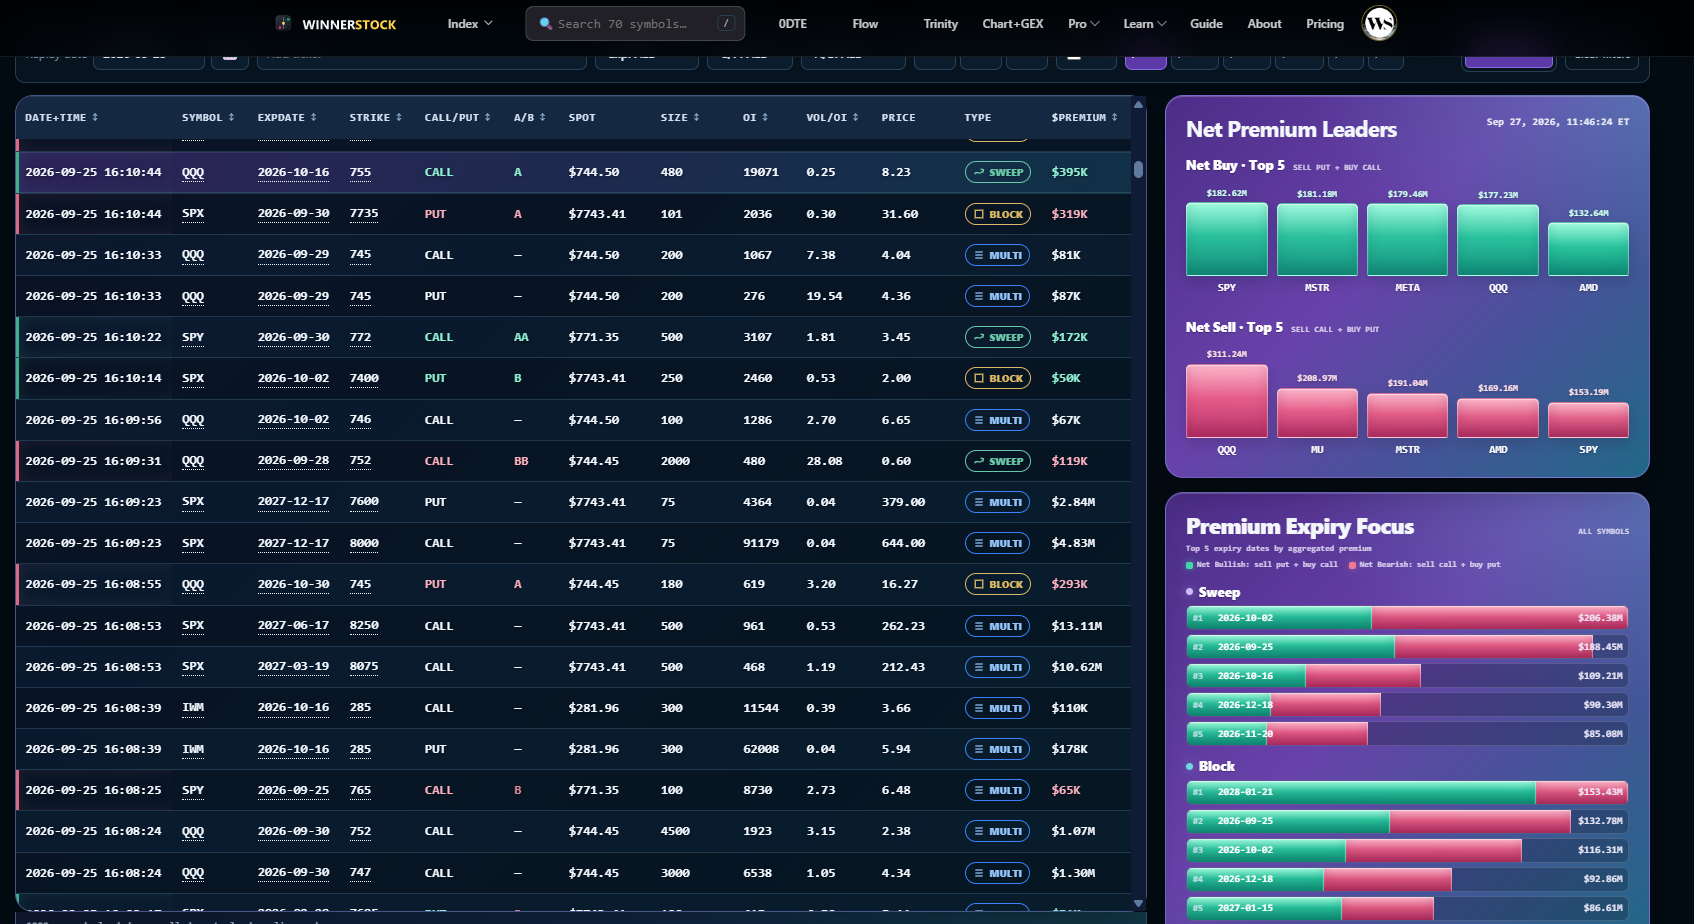
SPX 0DTE Position
Read 0DTE SPX positioning by premium and strike.
Compare call net premium, put net premium, directional net flow, customer positioning by strike, and top net positions to see where intraday pressure is building.
Open 0DTE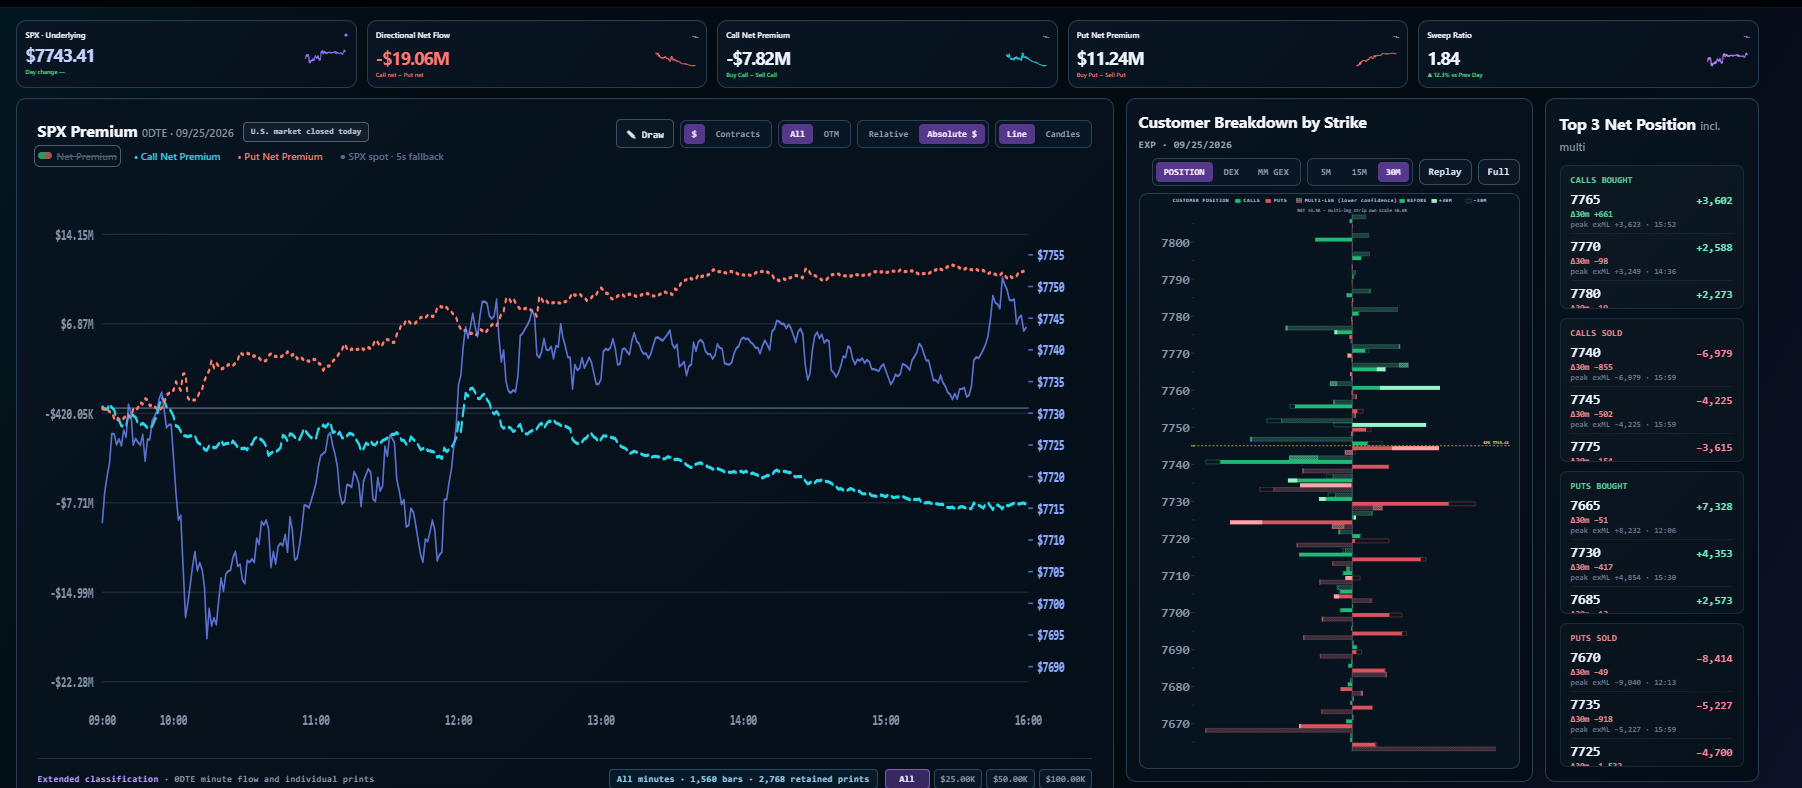
Stocks
Follow the names that move your portfolio.
Beyond the major indexes, WINNERSTOCK brings popular stocks into the same options-structure workflow, so investors can compare more opportunities in one place.
Continue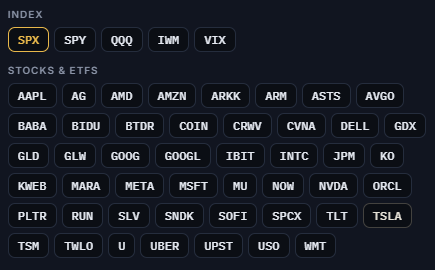
Membership
See the pressure. Keep your edge.
One product workspace for preparation, real-time structure, and a better end-of-day review.