The one-minute explanation
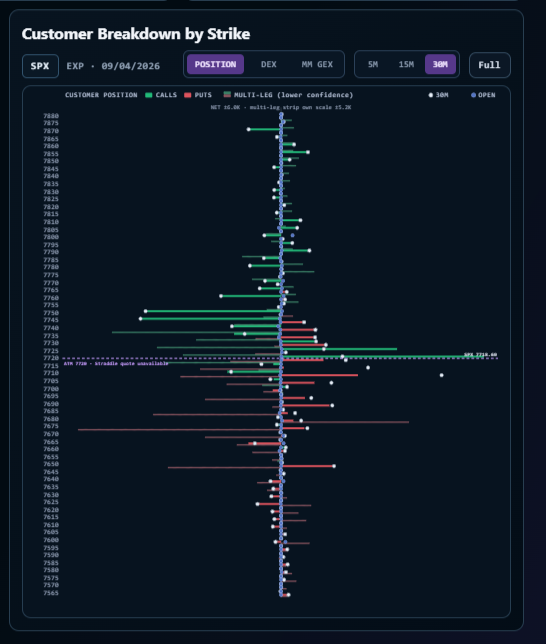
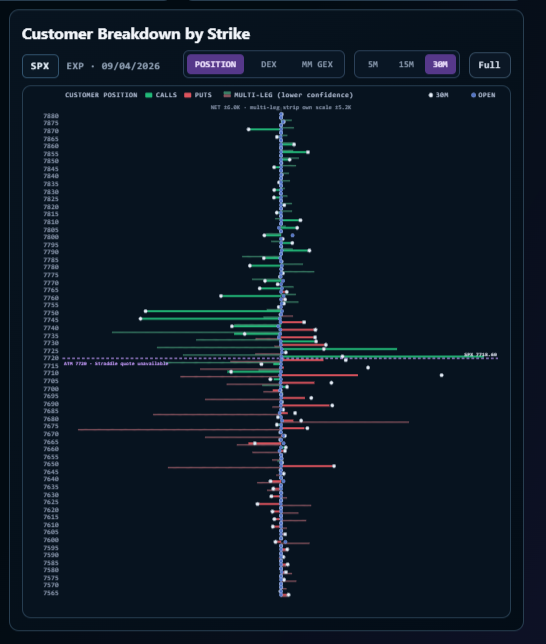
On the SPX 0DTE page, Customer Breakdown by Strike groups today’s option activity by strike price. Instead of reading thousands of individual trades, you can see which strikes have more buy-side or sell-side pressure in calls and puts.
Think of each strike as a shelf in a store. The chart shows whether more call or put contracts have been added to one side of that shelf during the session. It helps you find the areas worth watching when SPX gets close to them.
What you are looking at
How to read the Position view
In the default Position view, the chart estimates the net direction of today’s classified customer flow at each strike. The word “net” matters: buy activity is offset by sell activity. A bar can shrink later in the day when the opposite side trades.
Here is the easy rule: green on the right and red on the left can both lean bullish; green on the left and red on the right can both lean bearish. The color tells you the option type. The side of the center line tells you the sign.
A simple way to use the live chart
- Find spot first. Locate the highlighted SPX price area and note the two or three nearby strikes.
- Look for concentration. Longer bars mean more net classified activity at that strike relative to the other displayed strikes.
- Check the dots. If the current bar has grown away from its earlier dot, that pressure has increased in the chosen window. If it has moved back toward zero, it has faded.
- Change the time window. Use 5M, 15M, or 30M to compare the current reading with a recent snapshot. Short windows show quick changes; longer windows show more of the session’s structure.
- Watch price behavior. The chart identifies a level of interest; price action and risk management decide whether there is a trade.
Why 0DTE makes the chart useful—and fast-moving
0DTE means “zero days to expiration”: these SPX options expire the same day. Activity can concentrate around nearby strikes and can change quickly as traders open, close, hedge, or roll positions. That is why the chart is most useful as an intraday map, not as a static prediction for the whole day.
For example, a large call bar near the current price tells you that strike is active. If SPX approaches it, check whether the bar is still growing, whether put activity is appearing nearby, and whether price is accepting or rejecting that area. The best question is not “what will happen?” but “what is changing as price reaches this strike?”
The other two tabs: DEX and MM GEX
The same strike map has two additional lenses. They use the same calls-green, puts-red color language, but they answer different questions.
If you are new to the page, start with Position. After you can read the call/put bars and their changes, use DEX and MM GEX as extra context rather than trying to make a decision from one number.
What this chart cannot know
- A trade may be part of a spread, hedge, roll, or multi-leg strategy—not a simple directional bet.
- Trade classification can be incomplete or uncertain, especially when quotes move quickly.
- Open interest is a separate, prior-close background measure. It does not reveal who is long or short intraday.
- Large activity at one strike can matter without becoming support, resistance, or a price target.
Use the chart to organize attention and manage risk. Pair it with price, liquidity, time of day, and a predefined stop—not with certainty.
Bottom line
Customer Breakdown by Strike gives you a cleaner question to ask during a fast 0DTE session: which nearby strikes are attracting meaningful call or put pressure, and is that pressure strengthening or fading? That is much more useful than trying to interpret the option tape one print at a time.