


What AMZN and MSFT Showed Before the Gap
Forward-looking OI, GEX, DEX and VEX changes before the breakout, reconstructed from retained intraday snapshots for expiration 2026-07-31. Both names gapped after earnings inside this window — the question this report answers is what was visible in the chain on the session before each move.
The retained chain for AMZN and MSFT starts at 2026-07-29. Both tickers have their earliest retained option-chain snapshot on that date, and the historical exposure archive holds nothing for either name in this window. 2026-07-23 -> 07-28 is absent from the retained dataset, not omitted from the analysis. Coverage is three sessions - 07-29, 07-30, 07-31 - with 40+ intraday snapshots each (~12-minute cadence, 09:30-16:00 ET).
Why only three days. Hot-store retention for equity options is three trading sessions. The expected cold-archive backstop did not contain these earlier AMZN/MSFT equity chains, so this public report treats the missing 2026-07-18 -> 07-28 chain history as unavailable. That limitation is part of the evidence, not a cosmetic omission.
Snapshots after 16:00 ET are also excluded. The feed keeps repricing contracts against the after-hours underlying while the 5-minute spot series stops at the close; mixing the two fabricates exposure jumps.
01Event timeline
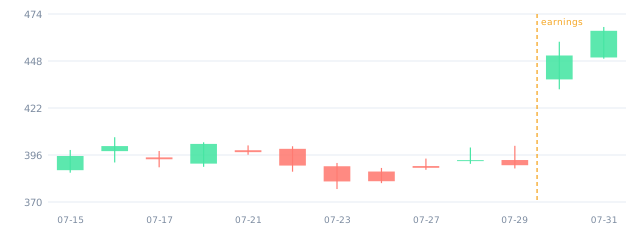
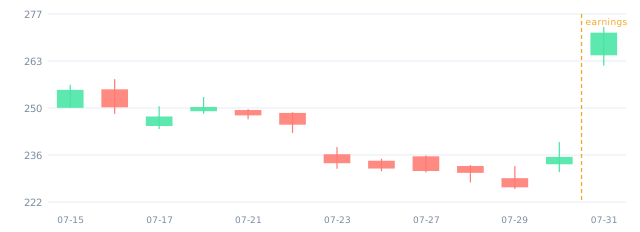
Both releases landed after the close, inside the retained window. The session immediately before each release is labelled T-1 — that is the "before the move" evidence.
02Signal matrix
One row per session, frozen at the last regular-hours snapshot. Open interest does not change intraday — it reflects positions built during the previous session. Volume and premium are the live flow for the day itself. Highlighted rows are the last session before each release.
| Symbol | Session | DTE | Open | Close | Session % | Call OI | Put OI | C/P OI | OTM call OI% | Δ Call OI | Δ Put OI | C/P vol | Call prem | Put prem | Prem C/P | OTM call prem% | ATM IV | RR5 | RR10 | Net GEX | Net DEX | Net VEX | Net CEX | Gamma flip | Call wall | Implied move | Next session | Realised ÷ implied | Gap hedge demand | as % of ADV |
|---|---|---|---|---|---|---|---|---|---|---|---|---|---|---|---|---|---|---|---|---|---|---|---|---|---|---|---|---|---|---|
| AMZN | 2026-07-29 | 2 | 229.46 | 228.17 | -0.56% | 211k | 76k | 2.78 | 90% | – | – | 1.54 | $42M | $52M | 0.80 | 18% | 111% | +0.009 | -0.036 | $18.8M | $50.4M | $673M | $-6.2M | 245.0 | 240.0 | ±9.9% | +3.9% | 0.40× | +1.43M sh | +4% |
| AMZN | 2026-07-30 | 1 | 233.30 | 237.38 | +1.75% | 231k | 92k | 2.52 | 76% | +19.4k | +15.5k | 2.13 | $162M | $71M | 2.27 | 38% | 175% | +0.022 | +0.003 | $39.6M | $934M | $540M | $-12.0M | 240.0 | 265.0 | ±11.0% | +15.3% | 1.39× | +9.43M sh | +21% |
| AMZN | 2026-07-31 | 0 | 267.79 | 271.76 | +1.48% | 350k | 164k | 2.14 | 19% | +119.2k | +72.0k | 2.28 | $437M | $34M | 12.86 | 0% | 35% | -0.210 | -0.190 | $70.7M | $319M | $61.1M | $-2.4M | 272.5 | 272.5 | ±2.2% | – | – | – | – |
| MSFT | 2026-07-29 | 2 | 393.63 | 392.44 | -0.30% | 172k | 74k | 2.33 | 74% | – | – | 1.49 | $68M | $56M | 1.22 | 30% | 111% | -0.030 | +0.021 | $27.1M | $911M | $1.16B | $-7.1M | 405.0 | 400.0 | ±9.9% | +15.5% | 1.56× | +7.55M sh | +24% |
| MSFT | 2026-07-30 | 1 | 436.57 | 455.36 | +4.30% | 199k | 109k | 1.83 | 28% | +26.8k | +34.8k | 1.82 | $386M | $55M | 6.99 | 18% | 50% | -0.131 | -0.181 | $78.8M | $6.70B | $-897M | $18.2M | 392.5 | 450.0 | ±3.1% | +3.0% | 0.96× | -1.01M sh | -3% |
| MSFT | 2026-07-31 | 0 | 458.51 | 462.42 | +0.85% | 207k | 158k | 1.31 | 18% | +8.4k | +49.6k | 1.76 | $229M | $27M | 8.55 | 0% | 38% | -0.182 | -0.347 | $77.9M | $1.68B | $2.2M | $-12.7M | 455.0 | 465.0 | ±2.4% | – | – | – | – |
OTM Call OI% — call OI at strikes ≥ spot × 1.03, as a share of all call OI. Call premium — rebuilt as Σ (volume increment × price at that snapshot × 100); a VWAP-style approximation, not tape premium. RR5 / RR10 — risk reversal, IV(call at +5% / +10%) − IV(put at −5% / −10%); positive means upside vol is priced richer than downside, an inversion that is rare in single-stock options. The last five columns are outcome measures — what the following session did, and the hedging demand its gap created. They are shown here for calibration and were not knowable at the timestamp of the row.
03Conclusion — why they rallied, and what the chain actually explains
Both moves happened overnight, between sessions, on the earnings release. The fundamental surprise is the cause, and no option metric explains it. Anything here that reads like "the chain predicted it" is an overreading. What the chain does explain is which way the market was leaning, and why the move that followed was so much larger than the one that had been priced.
Implied vol told everyone a large move was coming: MSFT's T-1 ATM IV of 111% priced ±9.9%, AMZN's 175% priced ±11.0%. But an implied move is symmetric — it carries no direction. The directional content sat in two places:
- Skew. Single-stock options normally price downside vol richer. On both T-1 sessions that inverted or flattened — MSFT RR10 +0.021, AMZN RR10 +0.003 after -0.036 the session before. Someone was paying up for upside.
- Positioning. 74% and 76% of call OI sat more than 3% out of the money, and 38% of AMZN's T-1 call premium was aimed there.
So the chain was aligned with an upside surprise, and it got one. That is alignment, not prediction — the identical configuration ahead of a bad print produces a violent gap down.
- Both moves exceeded what was priced. MSFT realised +15.5% against ±9.9% implied (1.56×); AMZN +15.3% against ±11.0% (1.39×). Dealers hedge to the distribution they sold — when realised exceeds implied they are short delta they never provisioned for.
- Price gapped clean through the gamma flip and the call wall. MSFT closed T-1 at 392.44 with the flip at 405.0 and the call wall at 400.0, then opened at 436.57 — about 9% above the wall. AMZN closed at 237.38 with the flip at 240.0 and opened at 267.79, right at its 265.0 wall. The long-gamma regime that had been pinning both names on T-1 inverted overnight — the dealers selling rallies the day before woke up having to buy them.
- The forced hedging was large against real liquidity. Holding T-1 open interest and IV fixed and moving only spot to the next open, the gap alone created 7.55M shares of buying in MSFT ($3.31B, 24% of prior average daily volume) and 9.43M shares in AMZN ($2.50B, 21% of ADV) — calls supplying 6.3M and 8.0M of it. And that is one expiration out of the twenty-plus on the board.
- The intraday follow-through is the tell. A pure repricing gaps and then goes quiet. Both names climbed all session instead: MSFT opened +12.1% and closed +15.5%; AMZN opened +12.5% and closed +15.3%. Buying that persists into the close is what hedging demand looks like.
For contrast, the same calculation on a session with no release — AMZN 07-29 — returns 0.40× the implied move and only 4% of ADV in hedging demand. The T-1 readings are not the normal state of the world.
| Ranked factor | What it does | MSFT T−1 · 07-29 | AMZN T−1 · 07-30 | Knowable in advance? |
|---|---|---|---|---|
| 1 · Realised ÷ implied move | Decides whether hedging absorbs the move or amplifies it | 1.56× | 1.39× | No — needs the outcome |
| 2 · Gamma flip vs spot | Crossing it flips dealers from damping to amplifying | 405.0 vs 392.44 | 240.0 vs 237.38 | Yes |
| 3 · OTM call OI share | The supply of short-call delta that must be bought back | 74% | 76% | Yes — before the open |
| 4 · Net DEX in the OTM-call zone | Sizes the forced buying | $582M | $453M | Yes |
| 5 · Risk reversal RR10 | The only directional prior in the set | +0.021 | +0.003 | Yes |
| 6 · ATM IV against realised range | Measures how tightly the spring is wound | 111% IV vs -0.30% day | 175% IV vs +1.75% day | Yes |
The honest split: factors 2–6 were all on the screen before the release, and together they said the market is leaning up, and if it goes up the move will be amplified. Factor 1 — the thing that actually decides the magnitude — is only knowable afterwards. The chain gave a conditional statement about convexity, not a directional forecast. That conditional is still the tradeable part: it says the payoff is asymmetric, which is a different and far more defensible claim than knowing which way earnings will land.
04Five pre-gap signals, in the order they appeared
Both names opened their T-1 session already carrying a stack of out-of-the-money call positions (OI is fixed intraday; it reflects what was built the session before). MSFT on 07-29: 74% of call OI beyond +3%. AMZN on 07-29 was higher still at 90%. Call/put OI ratios were 2.33 and 2.78. On a weekly contract with two sessions left, 74–90% of call OI sitting out of the money means the position structure itself is a one-way earnings lottery ticket, not the covered-call or hedging mix you would normally find.
Contract ratios are inflated by cheap far-OTM strikes, so follow the dollars. AMZN on its T-1 (07-30) traded $162M of call premium against $71M of puts — a ratio of 2.27 — and 38% of it (about $61M) went to strikes more than 3% out of the money. MSFT's T-1 figure was 30% (about $21M). Note AMZN's share went from 18% on T-2 to 38% on T-1 — the acceleration is the signal.
Single-stock options normally carry put skew: at equal moneyness, put IV exceeds call IV and RR is negative. On both T-1 sessions RR moved to zero or above — MSFT 07-29 RR10 = +0.021; AMZN 07-30 RR5 = +0.022, RR10 = +0.003. AMZN's RR10 went from -0.036 on 07-29 to 0.003 on 07-30 — the skew was flattened inside 24 hours. That is confirmation in the pricing rather than in the volume, which makes it much harder to contaminate with one-sided order noise.
MSFT closed 07-29 with net DEX of $911M, of which the OTM-call zone alone carried $582M. AMZN's net DEX went from $50.4M on 07-29 to $934M on 07-30, with $453M in the OTM-call zone. Positive DEX weighted above spot means that once the underlying moves up, dealers have to keep buying stock against a short delta that grows as it goes — the move carries its own fuel.
Net GEX was positive on both T-1 sessions (MSFT $27.1M, AMZN $39.6M), with gamma flip levels at 405.0 and 240.0 — both well above spot. Positive GEX means dealers are long gamma, selling rallies and buying dips, suppressing realised volatility. That is why neither name moved much on the day before its release (MSFT 07-29 -0.30%, AMZN 07-30 just +1.75%) while ATM IV sat at 111% and 175%. Realised volatility crushed flat, implied volatility at extremes, and the money all in out-of-the-money calls — those three together are the characteristic pre-gap fingerprint.
05Session detail
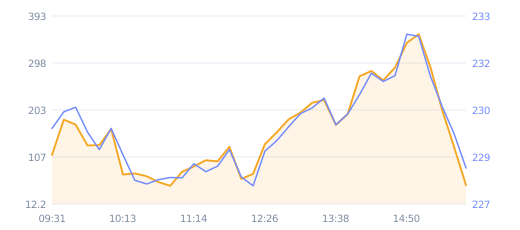
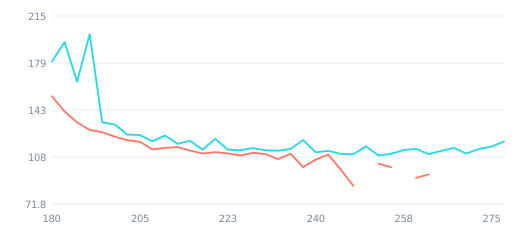
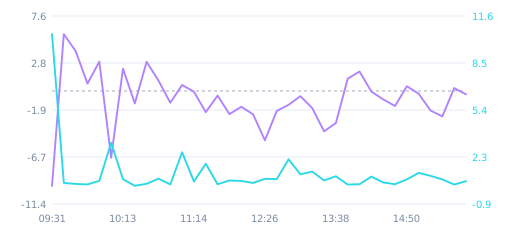
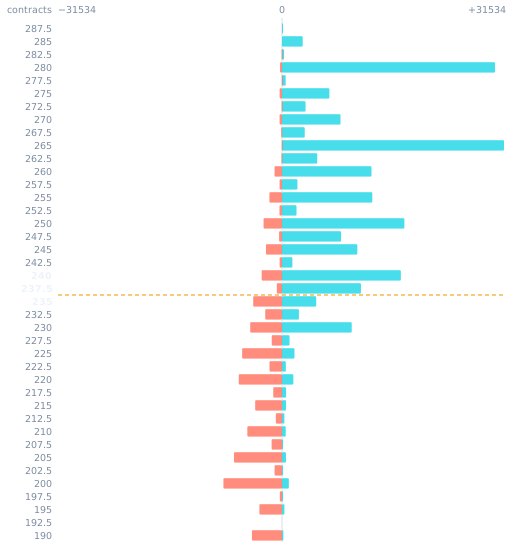
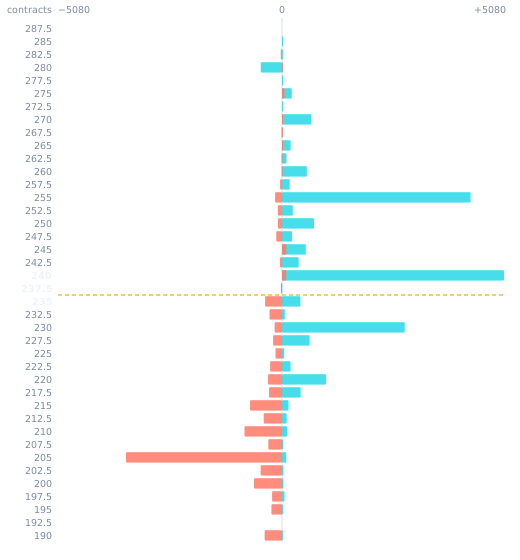
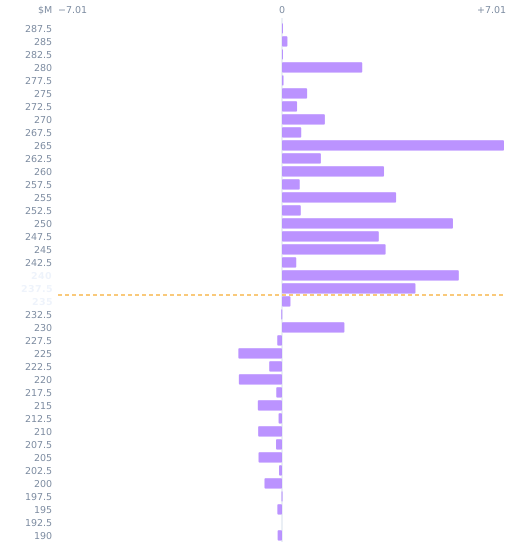
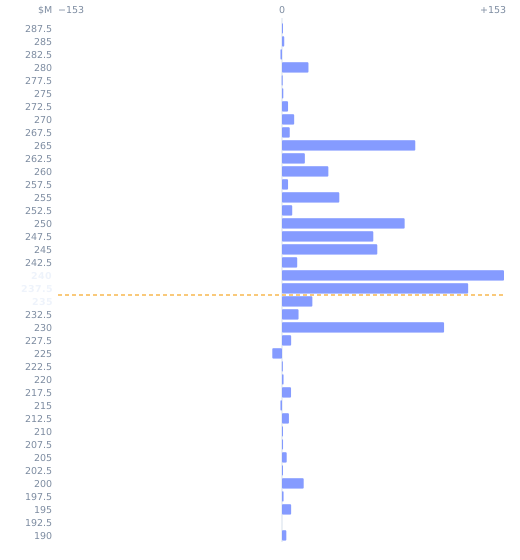
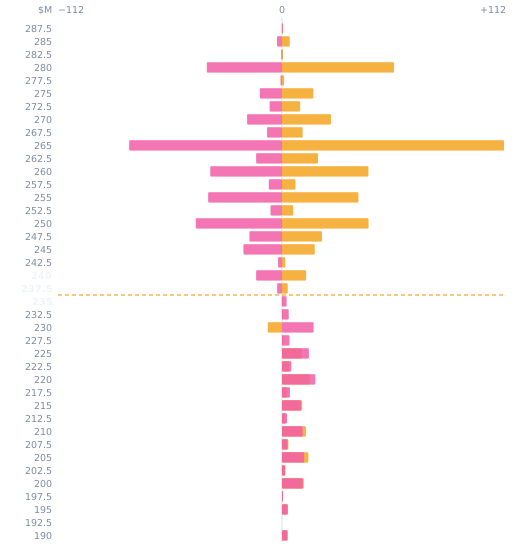
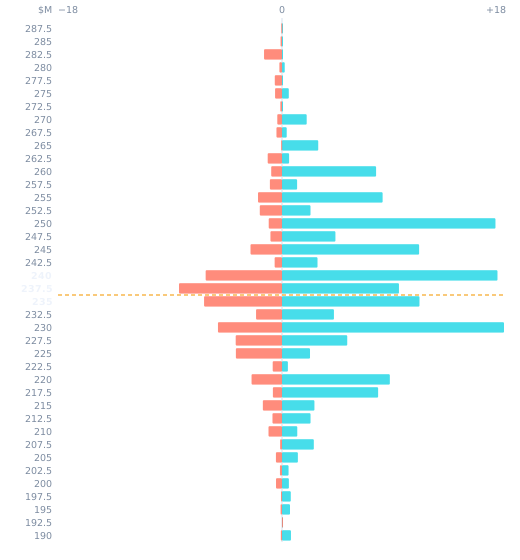
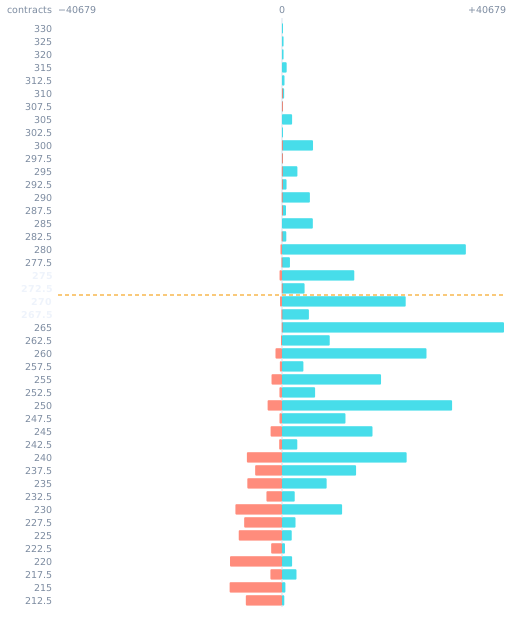
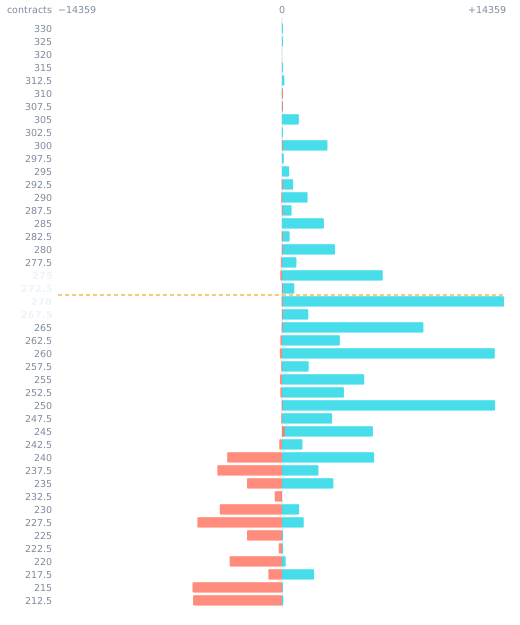
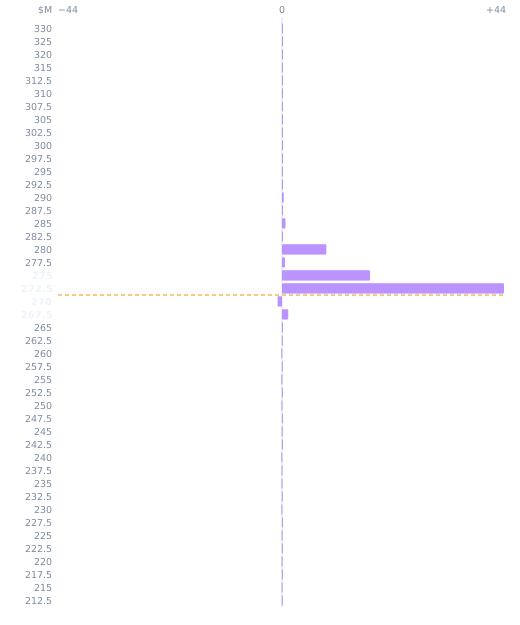
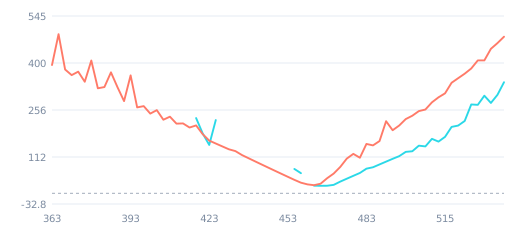
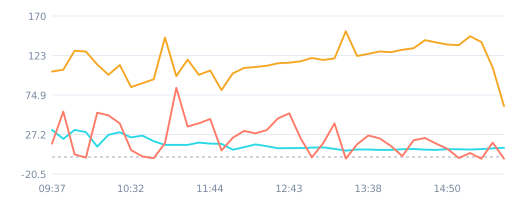
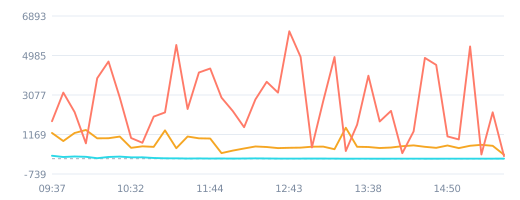
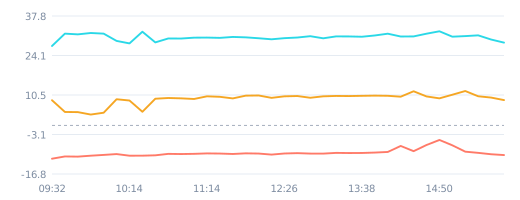
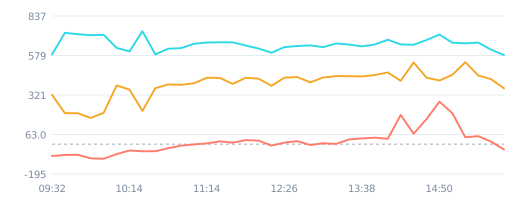
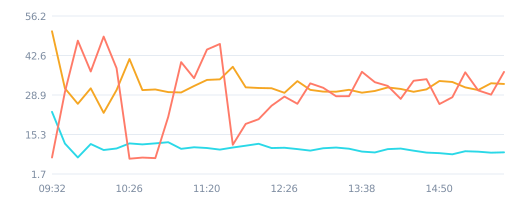
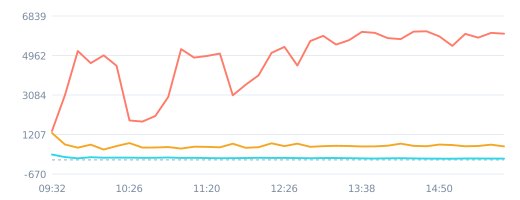
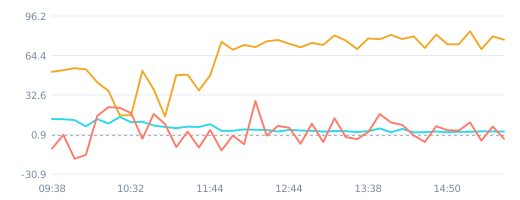
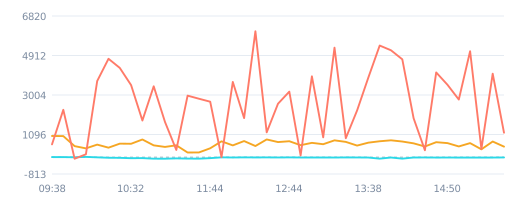
Select a session. Ladder charts cover spot ± 22%; every series carries a text label as well as a colour.
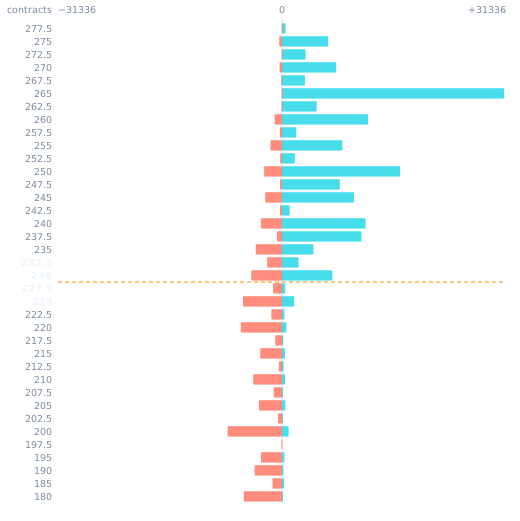
No comparison available — 2026-07-29 is the first retained session for AMZN, so there is no prior-day open interest to difference against. See the coverage advisory.
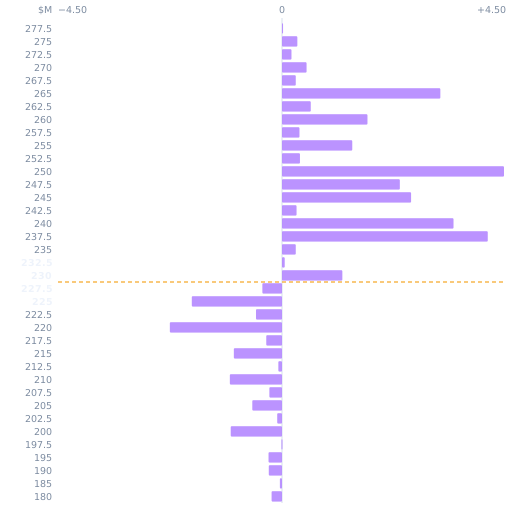
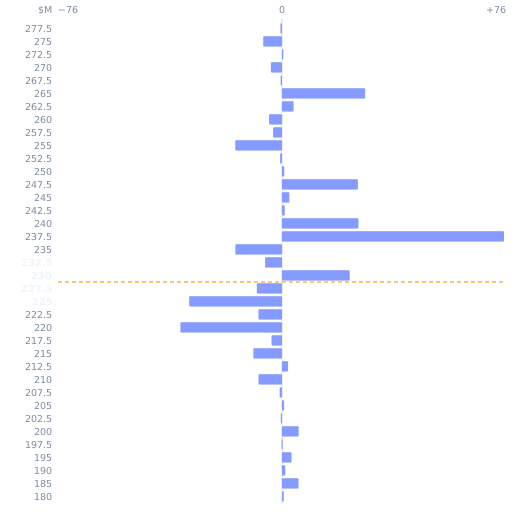
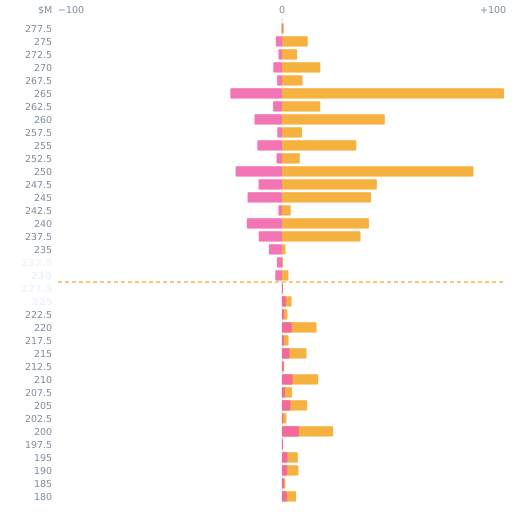
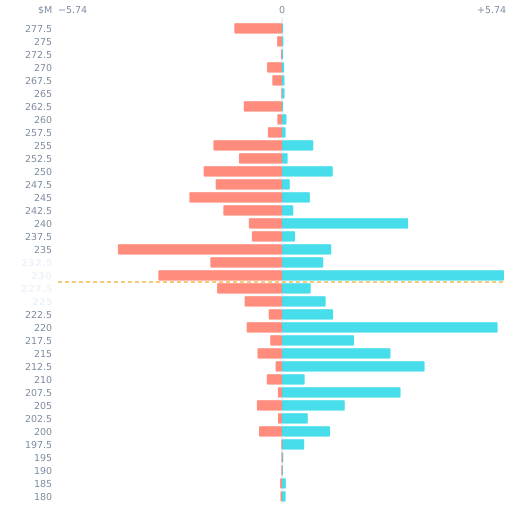
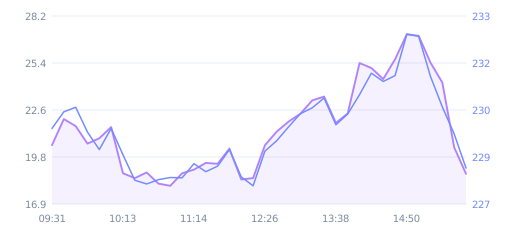
 Open chart 11 at original size ↗
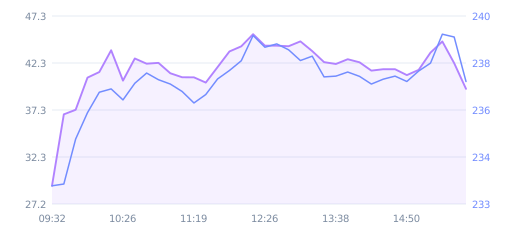
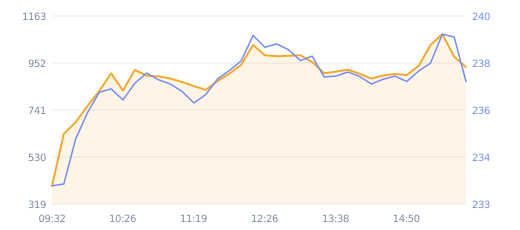
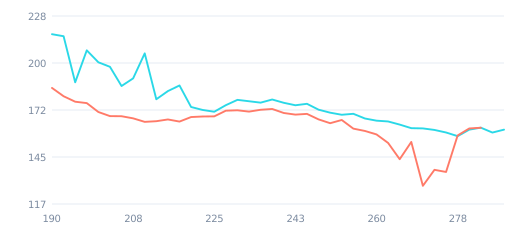
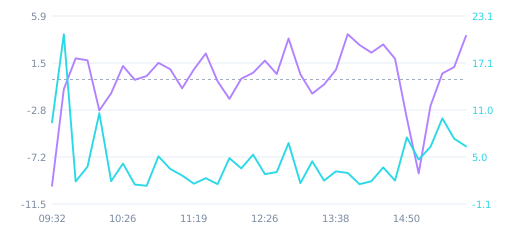
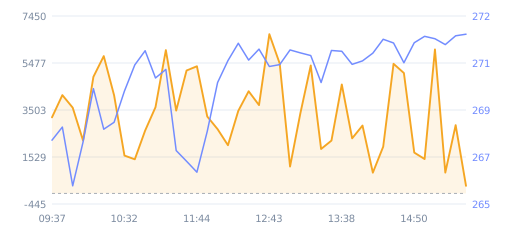
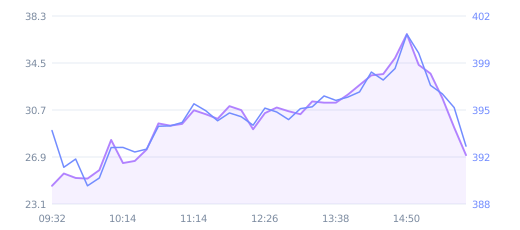
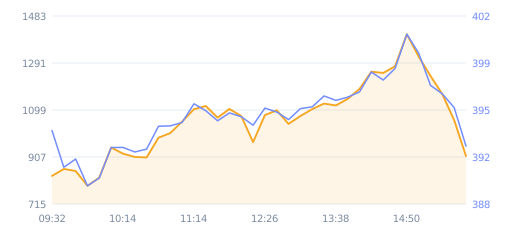
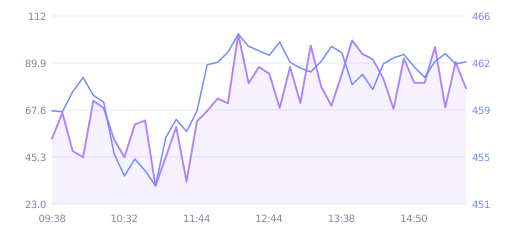
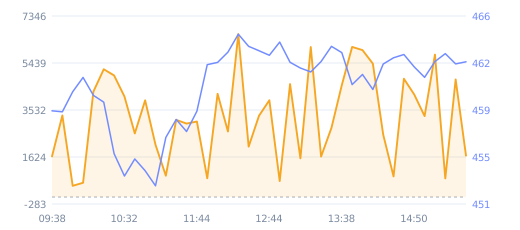
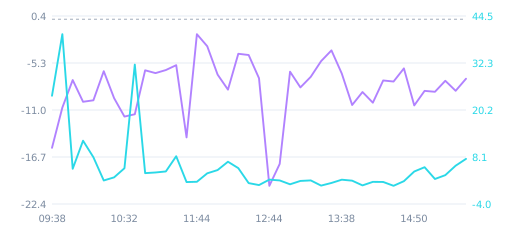
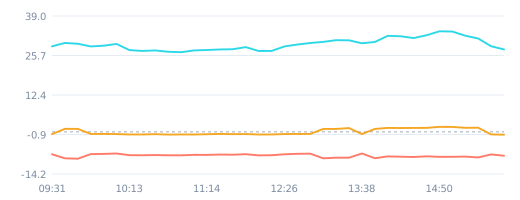
Above the zero line means the call premium arriving in that slot was aimed above spot. The first slot (09:32) carries the opening cumulative volume and is indicative only.
 Open chart 21 at original size ↗
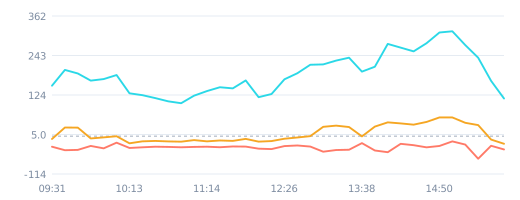
Above the zero line means the call premium arriving in that slot was aimed above spot. The first slot (09:32) carries the opening cumulative volume and is indicative only.
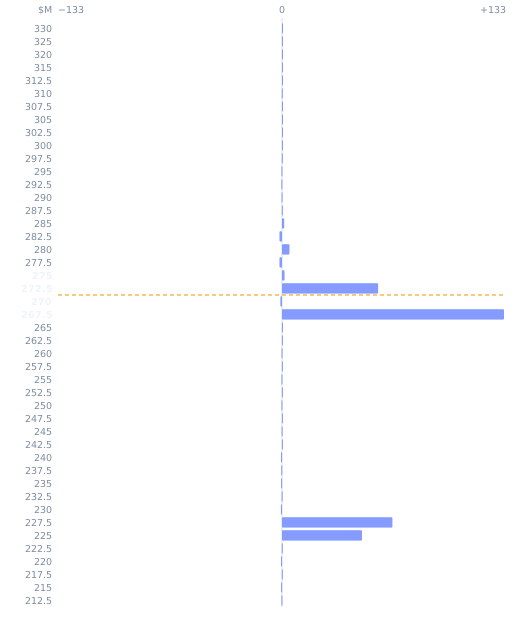
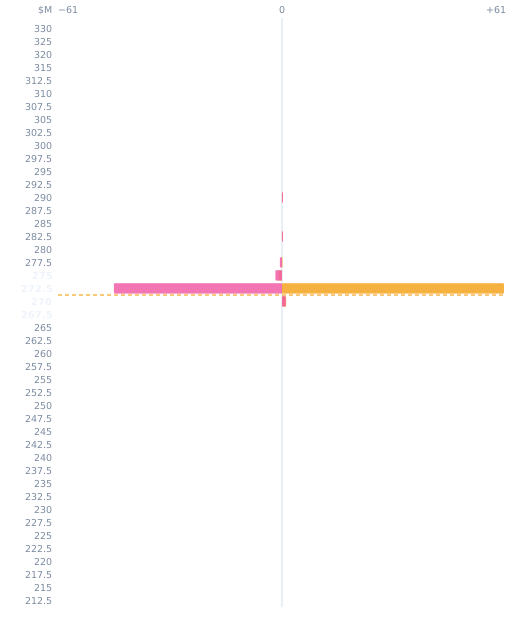
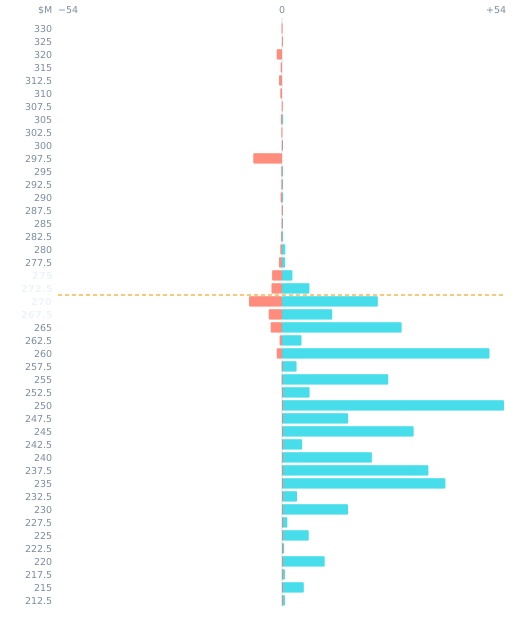
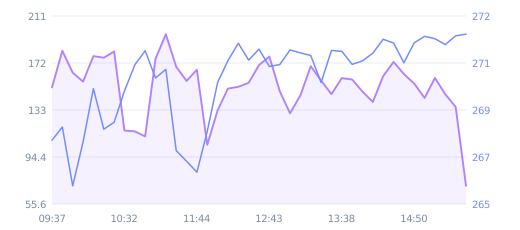
 Open chart 31 at original size ↗
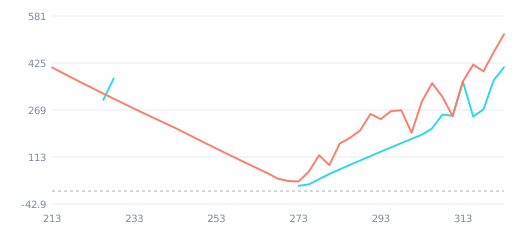
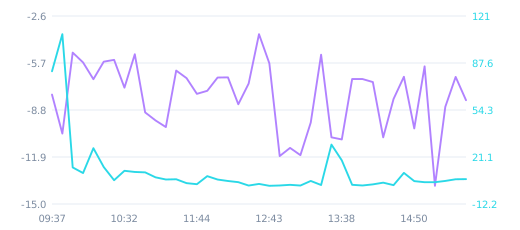
Above the zero line means the call premium arriving in that slot was aimed above spot. The first slot (09:32) carries the opening cumulative volume and is indicative only.
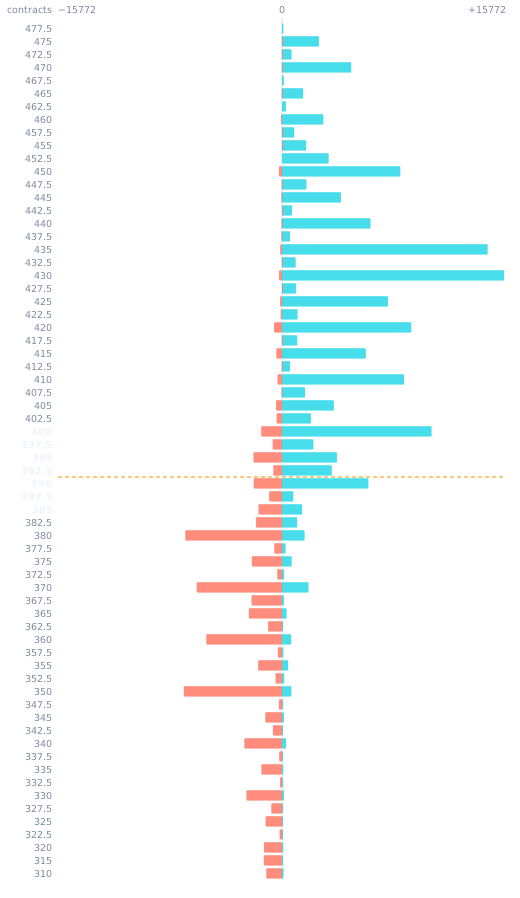
No comparison available — 2026-07-29 is the first retained session for MSFT, so there is no prior-day open interest to difference against. See the coverage advisory.
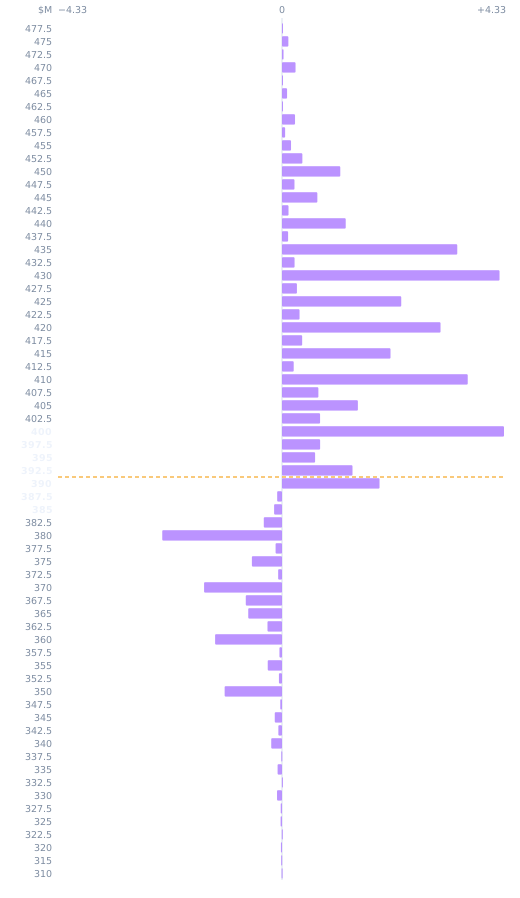
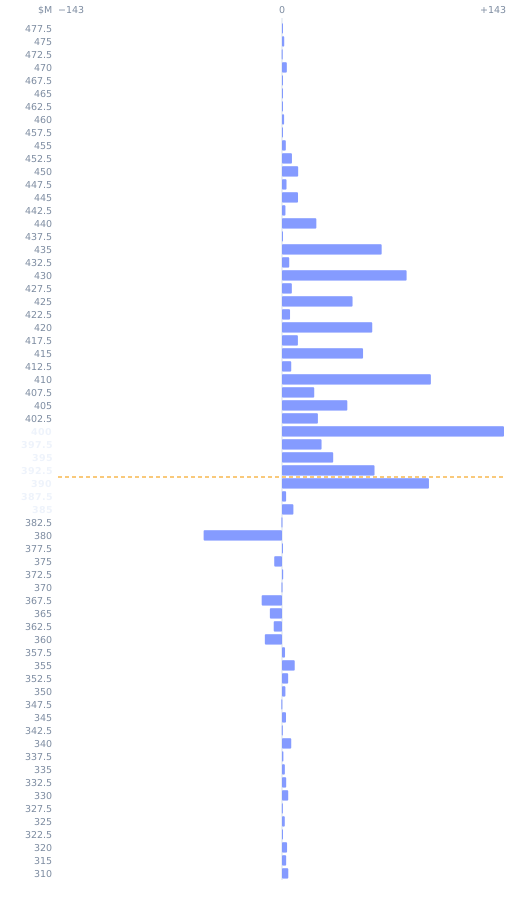
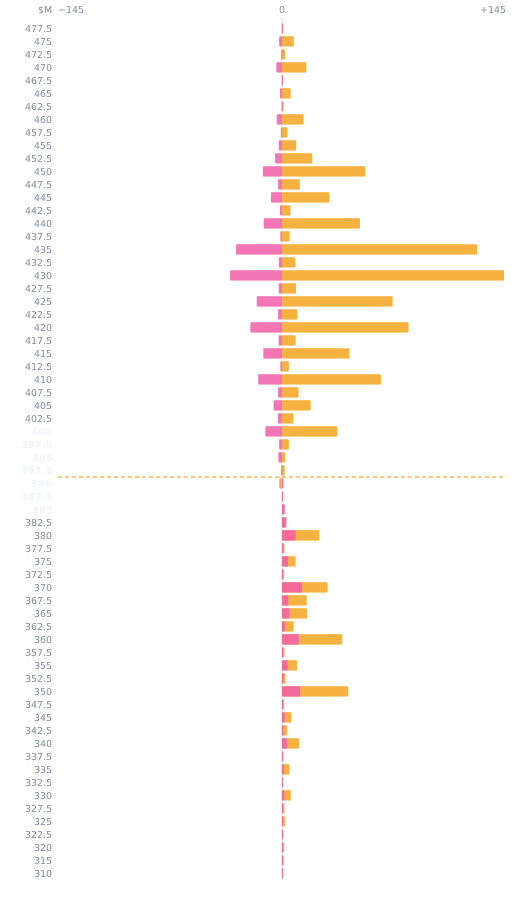
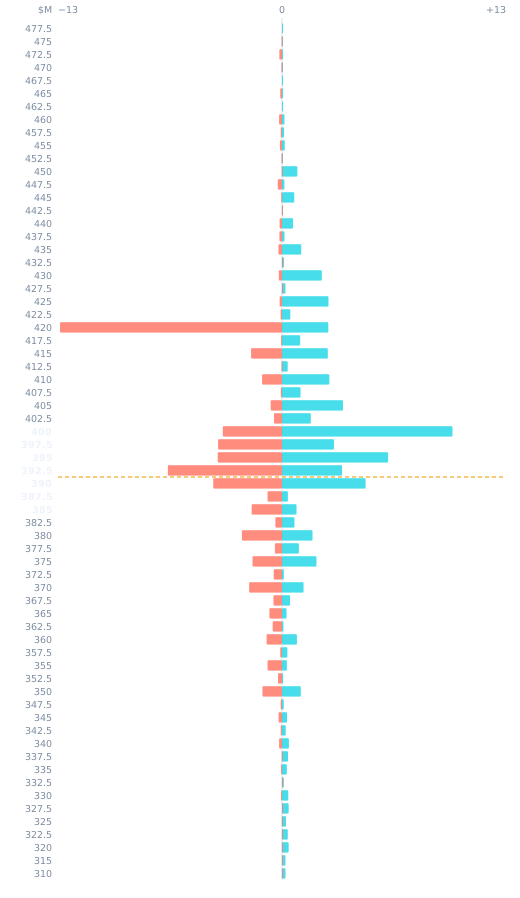
 Open chart 40 at original size ↗
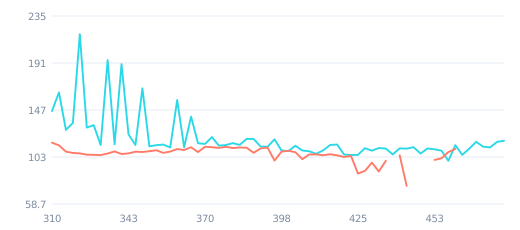
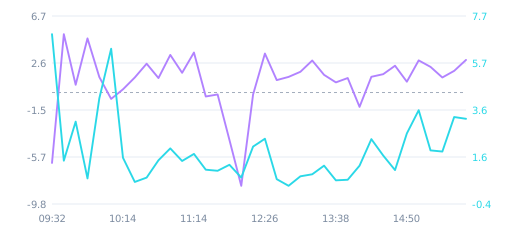
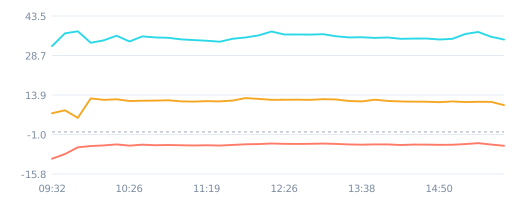
Above the zero line means the call premium arriving in that slot was aimed above spot. The first slot (09:32) carries the opening cumulative volume and is indicative only.
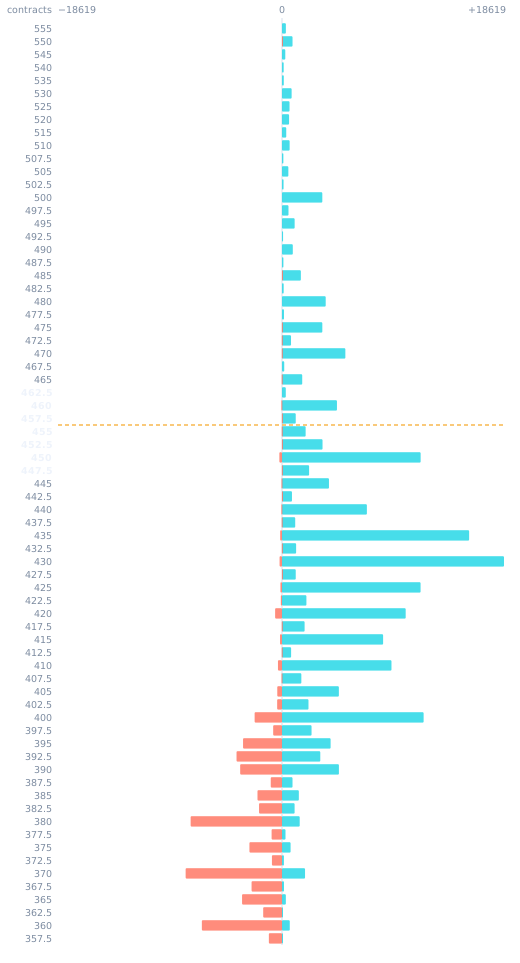
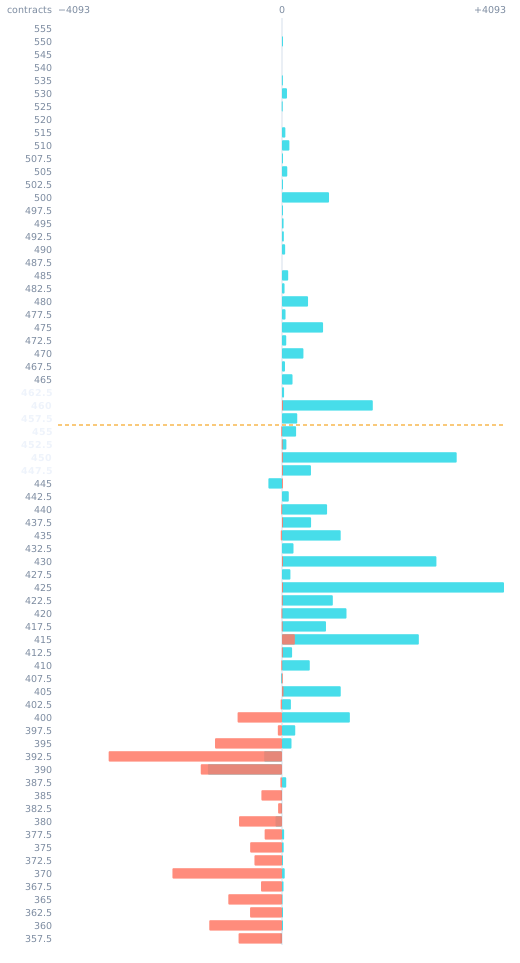
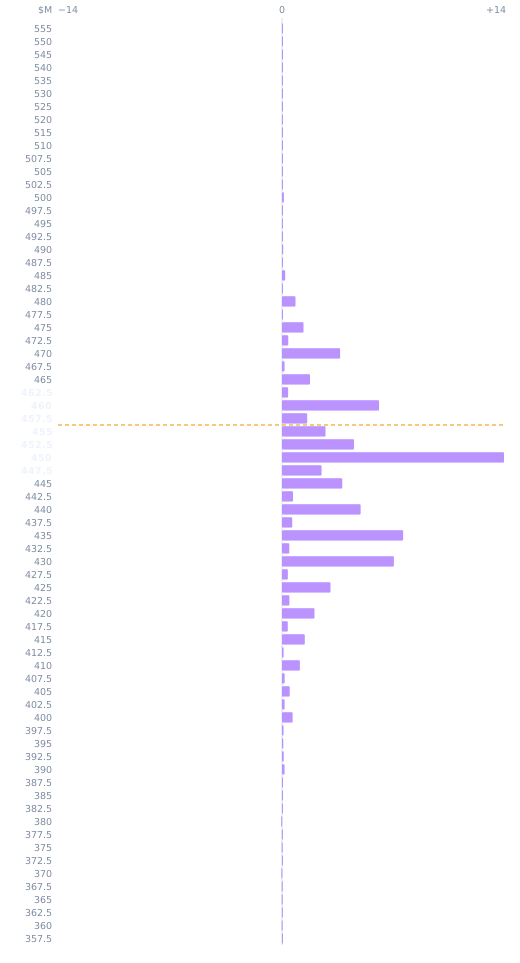
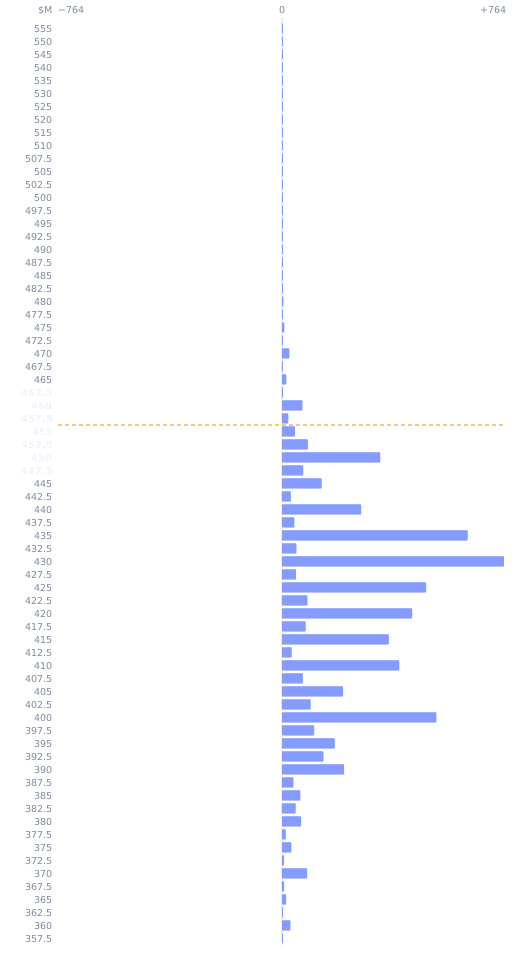
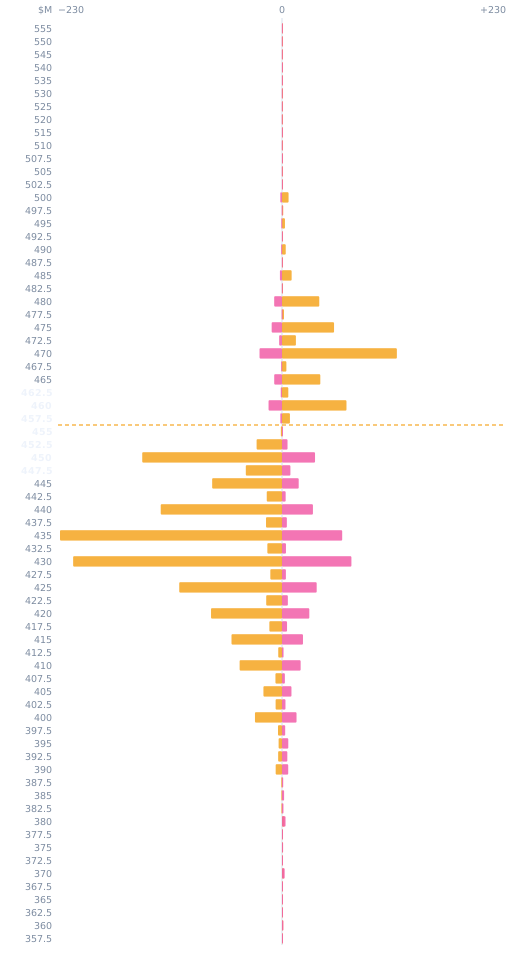
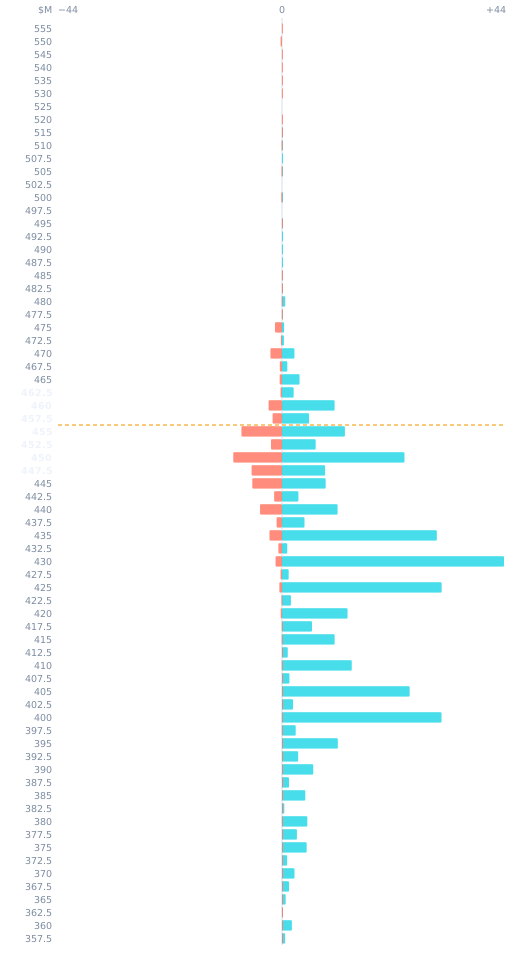
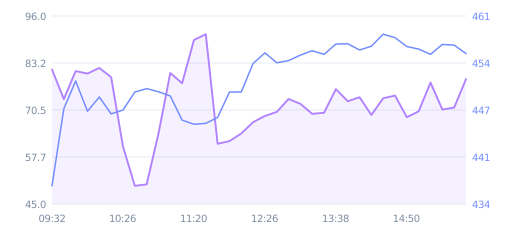
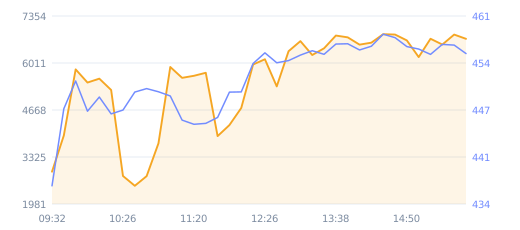
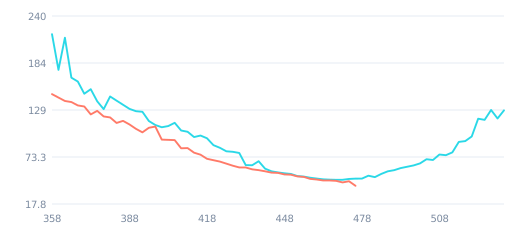
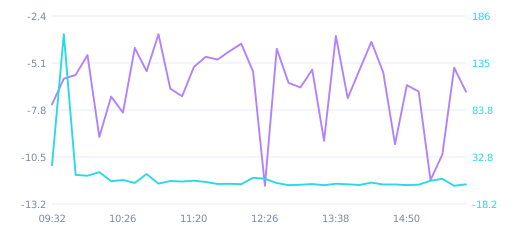 Open chart 50 at original size ↗
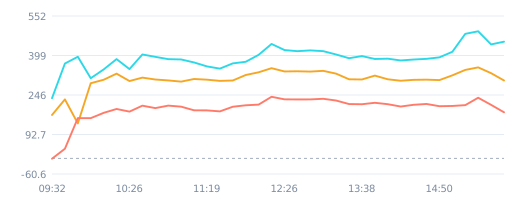
Above the zero line means the call premium arriving in that slot was aimed above spot. The first slot (09:32) carries the opening cumulative volume and is indicative only.
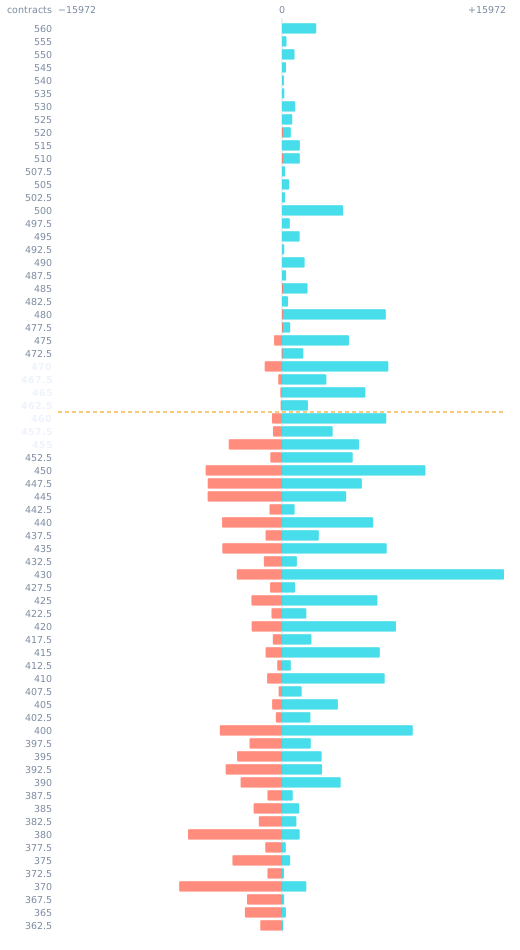
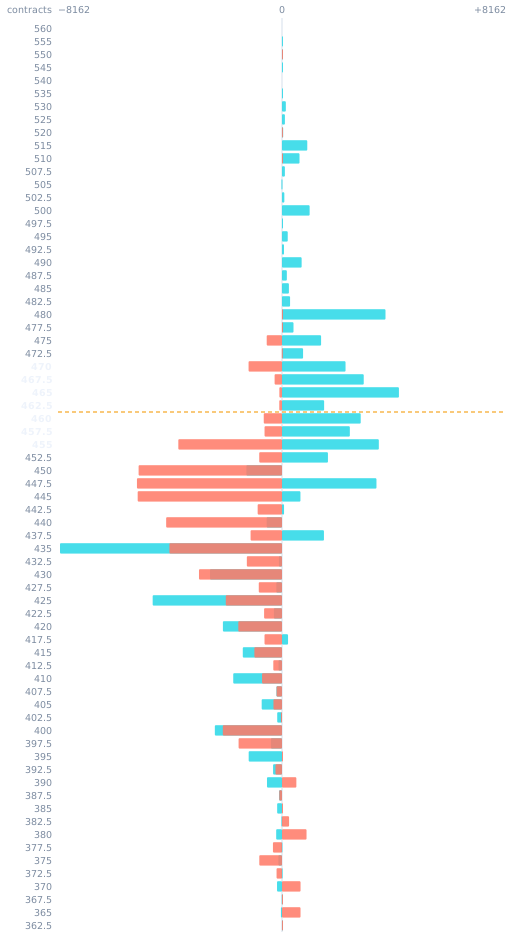
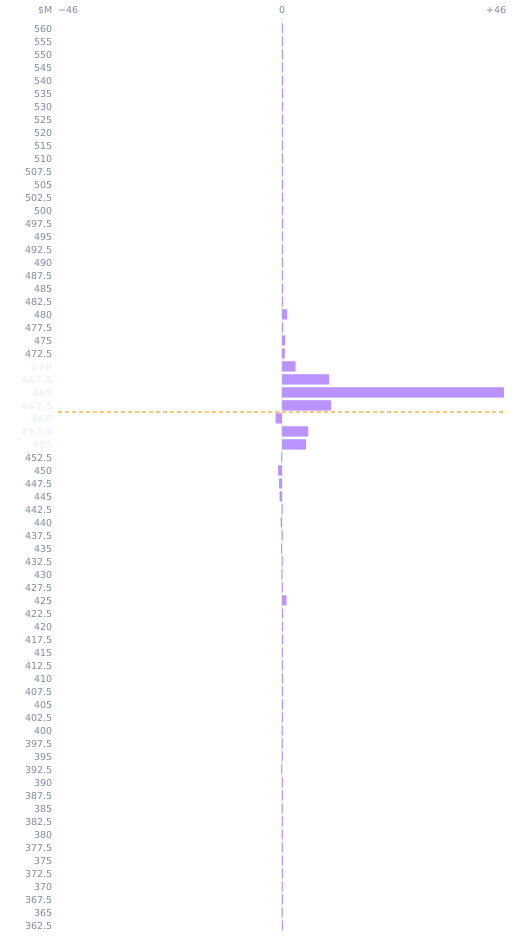
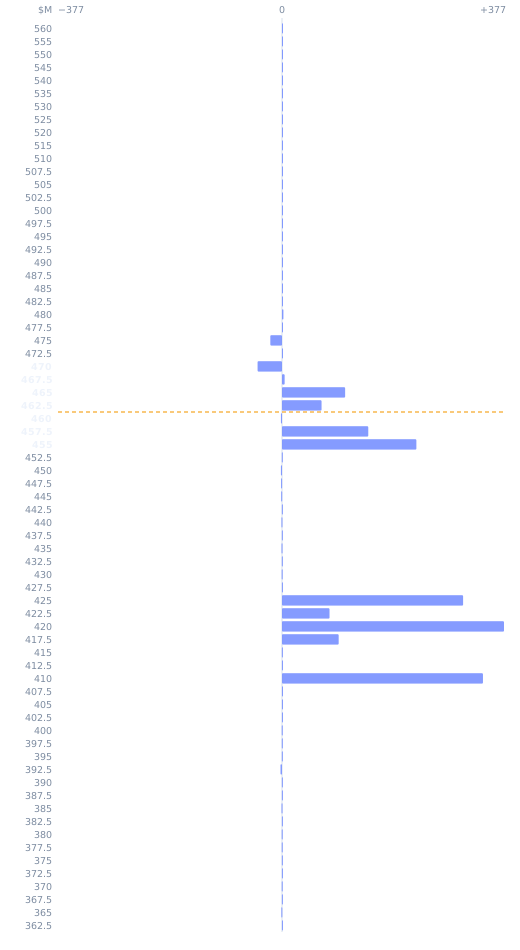
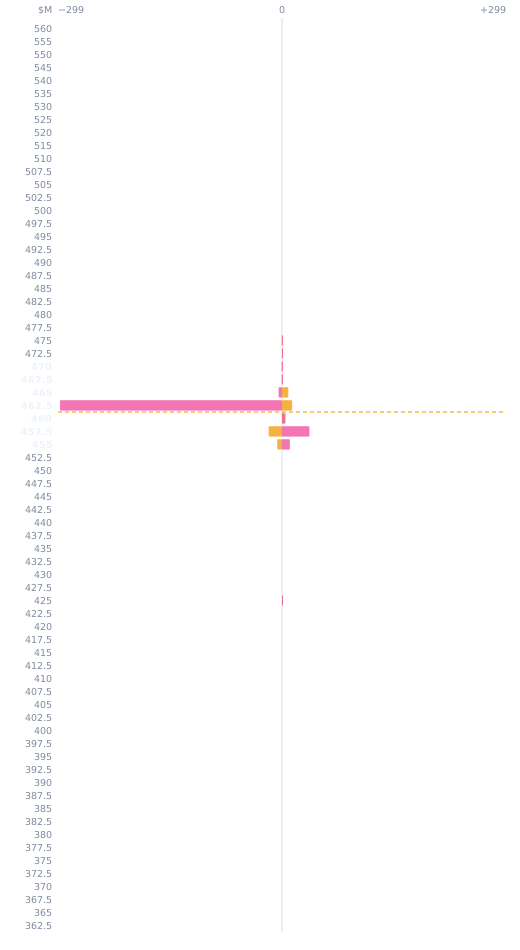
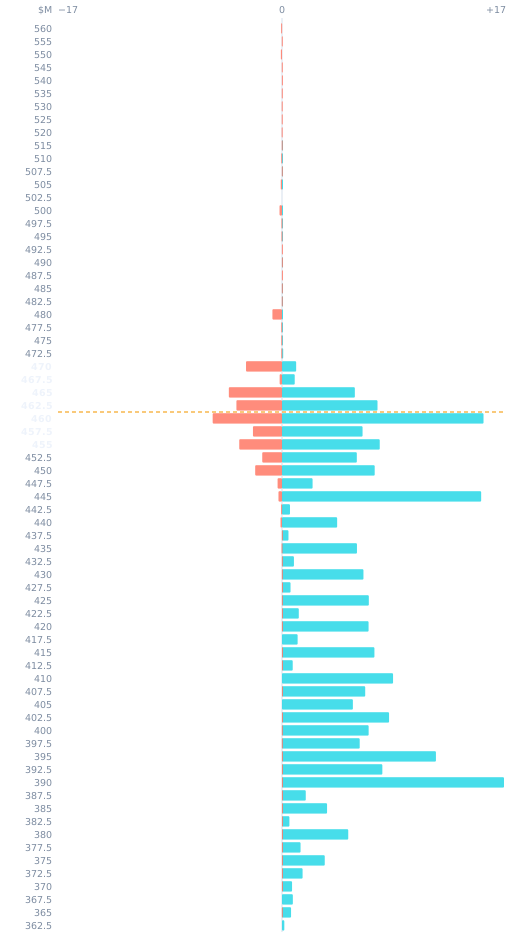
 Open chart 60 at original size ↗
Above the zero line means the call premium arriving in that slot was aimed above spot. The first slot (09:32) carries the opening cumulative volume and is indicative only.
06NET GEX / NET DEX migration across ATM and OTM
ATM band is spot ± 2%. OTM_CALL is above spot, OTM_PUT below. Zones are assigned against that day's spot, so a strike changes zone after the gap — that reassignment is itself part of the exposure migration. Values in millions of dollars.
| Symbol | Session | Spot | Metric | All strikes | ATM (±2%) | OTM call (above) | OTM put (below) |
|---|---|---|---|---|---|---|---|
| AMZN | 07-29 | 228.17 | Net GEX | +18.8M | -0.9M | +27.8M | -8.0M |
| Net DEX | +50.4M | -22.9M | +113.3M | -40.0M | |||
| AMZN | 07-30 | 237.38 | Net GEX | +39.6M | +10.1M | +34.7M | -5.2M |
| Net DEX | +934.0M | +302.3M | +452.8M | +178.9M | |||
| AMZN | 07-31 | 271.76 | Net GEX | +70.7M | +61.6M | +11.1M | -2.0M |
| Net DEX | +319.3M | +191.0M | +3.6M | +124.7M | |||
| MSFT | 07-29 | 392.44 | Net GEX | +27.1M | +8.7M | +28.6M | -10.2M |
| Net DEX | +911.1M | +364.6M | +581.7M | -35.3M | |||
| MSFT | 07-30 | 455.36 | Net GEX | +78.8M | +32.8M | +9.2M | +36.9M |
| Net DEX | +6702M | +641.3M | +61.6M | +5999M | |||
| MSFT | 07-31 | 462.42 | Net GEX | +77.9M | +77.1M | +3.3M | -2.5M |
| Net DEX | +1680M | +510.2M | -13.0M | +1183M |
07Whole-chain context (all expirations)
Every section above isolates expiration 2026-07-31. This table aggregates all expirations at each session close, to show whether the pre-gap tilt was concentrated in the weekly or ran through the whole term structure.
| Symbol | Session | Expirations | Chain net GEX | Chain net DEX | Exp 07-31 share of GEX | Exp 07-31 share of DEX | Chain call OI | Chain put OI | C/P OI |
|---|---|---|---|---|---|---|---|---|---|
| AMZN | 07-29 | 23 | +66M | +3473M | 28% | 1% | 2617k | 1704k | 1.54 |
| AMZN | 07-30 | 23 | +151M | +9748M | 26% | 10% | 2614k | 1716k | 1.52 |
| AMZN | 07-31 | 23 | +406M | +29672M | 17% | 1% | 2832k | 1860k | 1.52 |
| MSFT | 07-29 | 21 | +148M | +8109M | 18% | 11% | 2740k | 1241k | 2.21 |
| MSFT | 07-30 | 22 | +433M | +45676M | 18% | 15% | 2773k | 1300k | 2.13 |
| MSFT | 07-31 | 22 | +470M | +42700M | 17% | 4% | 2750k | 1382k | 1.99 |
08Screening checklist
The five signals compressed into filters you could run on the near-dated contract one or two sessions before an earnings release:
- ① OTM call OI share above 70% — call OI at strikes ≥ spot × 1.03 divided by all call OI. This is position structure, not intraday noise, so it can be computed before the open. Both T-1 readings were 74% and 76%; AMZN's T-2 reading was 90%.
- ② Premium-based call/put above 2, with OTM call premium share above 30%. Contract-count ratios are easily flooded by penny far-OTM strikes — rebuild premium as volume increment × traded price, as this report does.
- ③ RR10 at or above −0.02 (near zero or positive). Single-stock skew is normally negative, so a flip is confirmation in the pricing. The direction of change from T-2 to T-1 is more useful than the absolute level.
- ④ Net DEX positive and weighted above spot — the OTM-call zone supplying most of it. This is the fuel for continuation after the gap: dealers must chase.
- ⑤ Positive net GEX, gamma flip well above spot, extreme ATM IV, and near-zero realised intraday range. The harder price is pinned, the more violently it releases.
These matter only in combination. Any one of them alone produces plenty of false positives — especially ②, since buying OTM calls before earnings is ordinary behaviour. With two events across three sessions this sample cannot support a significance test; treat the list as a hypothesis to validate, not a strategy.
09Method, corrections and limits
Formulas — identical to fetcher/gex_engine.py (spot_x_100 scale)
GEX_k = (call_OI × call_gamma − put_OI × put_gamma) × S × 100DEX_k = (call_OI × call_delta + put_OI × put_delta) × S × 100VEX_k = (call_OI × call_vanna − put_OI × put_vanna) × S × 100— in this project VEX is vanna exposure, not vega exposure.CEX_k = Σ OI × (delta(T−1h) − delta(T)) × S × 100— charm (delta decay), by finite difference.- Gamma and delta come from the provider (massive) when present, Black-Scholes otherwise; vanna and charm are always Black-Scholes on the provider IV.
- Time to expiry uses the platform's near-term intraday convention — real remaining time to the 16:00 ET expiry close — with a 30-minute floor so 0DTE closing greeks do not diverge.
- Departure from the platform: this study applies no moneyness band and no OI threshold; the full strike ladder is computed.
Two data corrections that were required
- Snapshots after 16:00 ET are dropped. The feed keeps repricing contracts against the after-hours underlying while the 5-minute spot series stops at the close. Mixing them invents exposure jumps — AMZN's post-close 07-30 snapshots show the underlying at 252 while the options are still being scored against 235.5.
gex_engine._normalize_iv's percentage rescale is not applied. That helper treats IV > 3.0 as percent form and divides by 100. The massive feed in this dataset is always decimal, and genuine 1DTE/0DTE earnings IV legitimately exceeds 300%, so the rule would silently shrink real values by 100× — AMZN's 07-30 closing put IV of 3.07 would be recorded as 0.031.
Limits
- Three sessions, two events. 07-23 → 07-28 is absent (see the coverage advisory: 3-day retention plus a cold archive pointed at the wrong database), so the build-up cannot be observed earlier. Signal ① is a position-stock measure; a T-5 → T-2 series would establish where accumulation started and how steeply, far more reliably than the two or three points available here.
- Premium is reconstructed, not tape. Derived from volume differences across ~12-minute snapshots times the price at that moment. It cannot separate buyer- from seller-initiated trades and misses round trips inside a slot.
- Opening versus closing cannot be distinguished. ΔOI gives net change only. "OTM call OI rose" is also consistent with sellers opening short calls — although the RR flip and rising IV both favour the buyer-led reading.
- Dealer direction is assumed. GEX uses the conventional calls-positive, puts-negative sign; no actual dealer inventory is observed.
- Near-zero VEX and CEX on 07-31 (0DTE) is expected, not an error: vanna and charm both tend to zero at expiry.
Reproducibility note
The report was generated from retained read-only research snapshots, then summarized into derived strike-level metrics for this public case study. No production data was modified during report generation.
Dealer positioning is a convention, not observed inventory: GEX signs calls positive and puts negative in the industry-standard way. Premium is reconstructed from ~12-minute snapshots and cannot separate buyer-initiated from seller-initiated trades. Two events across three sessions cannot support a significance test. For research purposes only — not investment advice, and not an indication of future price direction. This report was prepared from retained read-only research snapshots; no production data was modified.